Risk management is seen as one of the most, if not the most, important elements in trading. As any successful trader knows, preserving your capital is crucial to your survival in markets. This is why ActivTrades offers its clients a very useful and helpful solution for every trader, regardless of their level.
The free tool is called SmartCalculator and it does a number of good things. You can calculate your expected return by setting a Take profit order and the allowed loss by setting a Stop loss order.
Basically, you write down your capital, choose a leverage and base currency and then enter the trade info - instrument, lots (goes to 0.01) and the position side - buy or sell. Then you insert open price, TP and SL and the system shows you important data as Pip value, potential gain and loss etc.
It's definitely worth checking, for those interested just go HERE.

Friday, March 31, 2017
Thursday, March 30, 2017
GBP/USD After Art 50 Triggering
GBP/USD is trading relatively unchanged after prime minister Theresa May triggered Article 50 yesterday. The initial step of the two-year process has been taken and now Brexit is officially confirmed.
Article 50 gives both the UK and the EU two years to reach agreement, meaning that the UK will leave on 29 March 2019, unless the sides agree to extend the period.
The GBP/USD pair reacted somehow neutral with a low of 1.2374, down from 1.2480 and currently trading at 1.2425.
As it turns out, the Art 50 triggering was a non-event, partially because market participants already knew about it and it did not come as a surprise. What happens next will determine how big of an impact will the process have on the UK economy and the UK currency.
Chart: GBP/USD H4

Wednesday, March 29, 2017
USD/JPY Higher
USD/JPY reached a high of 111.31 earlier today and is now gravitating towards the 111.00 levels. The pair reacted bullishly to yesterday's fundamentals and was picked up from a low of 110.10. Main trend on the short-term remains bearish with first bear target seen at the latest low.
Market sentiment appears to have shifted from bullish US dollar to bearish. USD/JPY was trading around 115.50 before Fed Chair raised the rates earlier this month. The rate hike affected the US dollar in a bearish way causing its peers to gain strength and momentum.
Now the US dollar looks a bit beaten down and it would need strong fundamentals or technicals so that it may shine again.
Chart: USD/JPY H4

Tuesday, March 28, 2017
USD/JPY Below Support
USD/JPY continues to trade to the downside in today's session. The pair registered a low of 110.10 yesterday and is now slightly higher at 110.70. However, main trend on the short-term remains bearish with very limited upside potential.
Bear camp has the advantage of a broken support level at 110.90 and now their first target is seen at 109.10. If we can reach that level, bulls might try to buy the dip.
Should the 109.00 level be broken, bears will have the momentum to continue pushing the pair down to major target at 105.
First support is seen at 109.30, first resistance is seen at 111.60.
Chart: USD/JPY H4

Monday, March 27, 2017
Gold Higher Amidst Uncertainty
Gold opened the early trading hours of the week with a new and improved momentum. The precious metal reached a high of $1,258 and is now trading slightly below it around $1,257. Main trend on the short-term remains bullish as price has made significant progress going from sub $1,200 to $1,257 in times when market experts expect the domination of the US dollar to continue.
Gold is proving them wrong with every new intraday high. First bull target is seen at $1,265, which marks a double top and bears may try to jump on it for a reversal of trend.
If that level is broken, Gold is looking to levels around $1,290-$1,300 as major target for the mid-term.
This week we expect little involvement of fundamentals into the market. The most important news for the week are stacked on Tuesday - Advance Goods Trade Balance, Consumer Confidence, Fed Chair Janet Yellen Speech.
Chart: XAU/USD H4

Wednesday, March 22, 2017
EUR/USD Stops At Resistance
EUR/USD is now trading at resistance in the short-term as the pair seems to have reached the point of a turn around. The price is now 1.0805, a bit lower from yesterday's high of 1.0820. Main trend, however, still remains bullish until we can confirm that bears have taken over and reversed the trend.
Immediate resistance rests at 1.0830, which can either ignite the spark for more momentum in the bull camp or be an opportunity for bears to sell at higher levels. The 1.0830 level is seen as a double top so that gives an edge to bears.
On the long-term price is expected to fluctuate due to high volatility caused by the implementation of the policies of President Trump and the divergence between his outlook on taxes, reforms and overall economic development compared to the views of Fed's Chair Janet Yellen.
Chart: EUR/USD H4

Tuesday, March 21, 2017
USD/CAD Consolidates
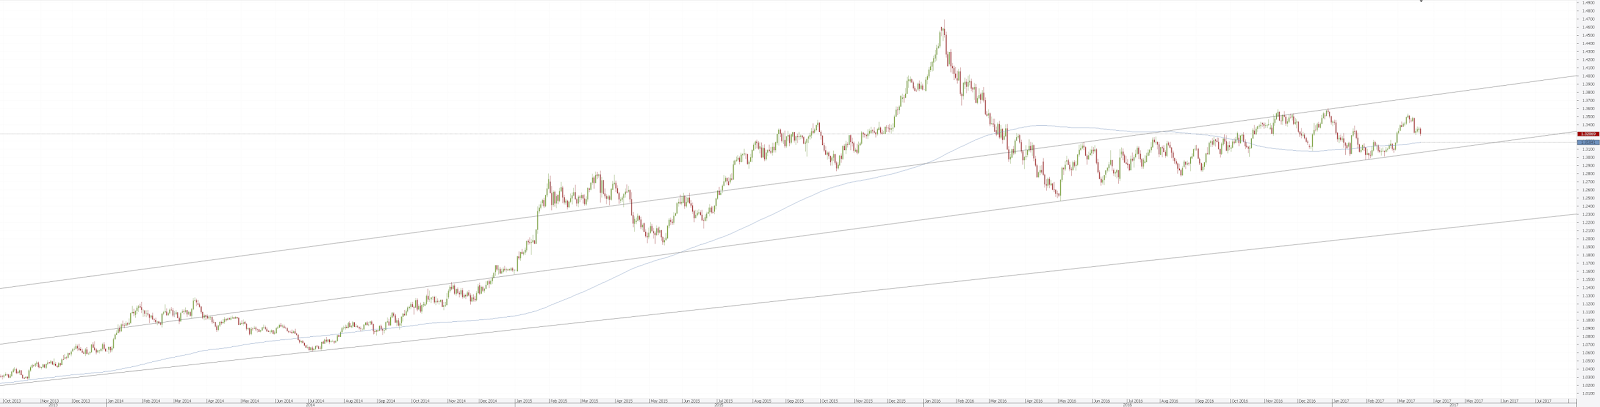
USD/CAD is trading slightly lower in today's session, but the overall trend still continues to consolidate between 1.3100 and 1.3500. The pair is now 1.3290, down from a high of 1.3535. Market participants don't seem to have a clear singular vision what to do with the pair and that indecisiveness is reflecting in the price. USD/CAD has been trading sideways since May last year when the big drop from 1.47 to 1.24 scared the bulls.

Short-term support rests at 1.3090, but before that bears will need to go through the 200SMA at 1.3184.
Bulls have the long-term advantage and they might try to buy in on the 200SMA, should the level be revisited. First bull target is seen at 1.36 and major target is 1.3880.
Chart: USD/CAD D1
Gold Moves Higher
Gold is having a bullish day today going from $1,227 to $1,241 just minutes before the opening of the US session. As stocks open flat, the precious metal has the chance to rally to first bull target at $1,250. If market participants favor the move in Gold, we might even see an attempt to visit the upper trend line on the short-term at $1,270.

On the other hand, bears are expecting another high before they get the chance to sell at a higher point. First bear target is seen at $1,225, while major bear target rests at $1,192.
A lot of market experts and analysts are recommending to go away from the Gold market and invest in the US dollar and equities with the hopes of a continuation of the Trump wave. However, as we can see, the US dollar is currently going down, while Gold rallies.
Chart: XAU/USD H4

Monday, March 20, 2017
AUD/USD At Resistance
AUD/USD is trading at resistance after the pair just touched the upper trend line. The price reached a high of 0.7746 and is now trading at 0.7724. If the momentum progresses, bears will push the price down to first target at 0.7660.
On the other hand, now is the time when bulls should muster up strength and climb higher above the resistance level at 0.7750.
Apart from Tuesday's speech by Janet Yellen we have no major news scheduled for the week. The Fed chair will be speaking on current economic direction, the outlook for the US economy and possible Q&A session.
That can give a new touch to the markets and the AUD/USD pair might react in high volatility. Until then, markets will be driven by technicals and not so much by fundamentals.
Chart: AUD/USD H4

Gold Tries To Go Higher
Gold opened higher in today's early trading hours before the European session. The precious metal has now reached a high of $1,235 as an intraday high and is now trading slightly below at $1,234. Main trend on the short-term remains bullish due to the green light given by the Fed. The rate hike turned out to be very beneficial for Gold, as well as Silver, and now the metals rally.
A correction might be expected around $1,243. If that level is taken over, the latest top at $1,262 becomes a target and also a mid-term resistance level. The bulls will need to push above the 200SMA that falls around $1,260 if they want to conquer higher levels.
Bears, on the other side, have a first target of $1,214, second target is seen at $1,190 and major bear target is expected at $1,145.
Chart: XAU/USD D1

Friday, March 17, 2017
A Technical Outlook on Q2 | Webinar Review
A technical outlook on global markets was presented on March 15 by professional trader Paul Wallace. In a webinar hosted by ActivTrades, Paul discussed the opportunities we can expect in the next three months and how to take advantage of them.
Global uncertainty presents many chances to go into the market and make profit, but that same chances can get you in trouble if you do not have a clear strategy and rules to obey.
The webinar also shed some light over a range of asset classes that help traders allocate their capital for better results. Risk management was also one of the main points as well as strategies for success in trading.
In case you missed the webinar, it is already uploaded HERE. To keep up with ActivTrades' free webinars, visit HERE.
Thursday, March 16, 2017
Gold Higher After Fed Raises Rates
The Federal Reserve raised the interest rates yesterday with 0.25 basis points. The US dollar reacted strongly bearishly on the announcement and the EUR/USD spiked to a high 1.0747 from a low of 1.0605.
Gold turned out to be the biggest gainer, alongside with Silver. Gold went from $1,199 to $1,227 this morning. It appears that market participants are getting optimistic about the future of precious metals.
Silver also registered a gain going from $16.82 to $17.49. A continuation of the upward move can be expected as we do not expect any major news or events that can shake the market at least until the end of the week. One mid-impact event is the Michigan Conference scheduled for Friday this week.
Chart: XAU/USD H4

Wednesday, March 15, 2017
GBP/USD Higher Amid Uncertainty
GBP/USD reached a high of 1.2256 in the early trading hours of today's session. The pair swinged sharply higher from yesterday's low of 1.2105 and is now trading at 12230. Partially, the climb is influenced by today's vote in the Netherlands and on the other hand, the uncertainty that comes with triggering Article 50 this month. Obviously, some market participants are optimistic about the independent near-term future of the United Kingdom.
The spike, however, might prove to be short-lived as market often make what may seem like irrational moves ahead of important events. This might be regarded as a correction before the pair continues to move to the downside.
Major support is seen at 1.2000, while major resistance it seen at 1.2570.
Chart: GBP/USD H4

Tuesday, March 14, 2017
GBP/JPY Still Consolidating
GBP/JPY continues to trade sideways with price fluctuating between 141.00 and 138.00. The pair entered into consolidation due to lack of fresh news that could drive investors and traders to either side.
Market participants are expecting the UK prime minister, Theresa May, to trigger article 50 this month and this is adding strength to the state of consolidation. Market sentiment remains bearish as price has been coming down from its 2015 high of 195.00.
Since then the market has been in a downtrend with a low of 122.40. Currently, the pair is trading at 139.80 in a predominantly bearish environment.
First support zone is seen at latest low around 138.00, first resistance is seen at 140.65. Bears need to close below 138.00 for the bearish trend to gain new momentum, while bulls need a close above 145.
Chart: GBP/JPY H4

Monday, March 13, 2017
EUR/CAD Reaches Double Top
EUR/CAD made an impressive rally to the upside. The pair has been trading with high volumes going higher and higher from the last week of February until now. Price back then was 1.3800 and the Canadian dollar is now trading at 1.4404 for a Euro.
What's interesting to notice is that the price has now reached a double bottom with the latest high at this level made in the end of November last year.
If price manages to power through the resistance level, bulls will have the upper hand in the trade with less obstacles in the way.
If, however, bears are able to halt the trend and turn it around, price might revisit prior support zones, the first of which is seen at 1.4220.
Have in mind that today's speech of ECB President Mario Draghi might have a high impact on the pair.
Chart: EUR/CAD H4

Friday, March 10, 2017
Gold Continues To Depreciate
Gold keeps going South as price has now gone below 1.5-month low at $1,196. Now it appears that the future of the precious metal could be determined by the Federal Reserve's decision to raise the interest rates. If next week the Fed does just that, Gold would most likely get hit harder. If not, Gold can hold up.
Today Gold went below the psychological level of $1,200 as bears did not even face a hint of resistance. Immediate support rests at $1,193, the Fib level of 61.8 falls on $1,176 and major support is $1,142.
If Gold is fortunate enough to stop at one of those levels, bull targets are seen at $1,230, $1,265 and $1,300.
It is also important to weigh Trump's policies as a factor that will likely shift the Fed's outlook.
Chart: XAU/USD H4

Thursday, March 9, 2017
GBP/USD Ahead of Art. 50 Triggering
GBP/USD has been in consolidation ahead of activating the never-before-used article 50 that triggers a two year process of a country's decision to leave the European union. The UK prime minister, Theresa May, is expected to start the divorce this month.
The resolutions that will come out of the talks will, to a large extent, determine the future of the United Kingdom. All of this is being reflected in the GBP/USD pair as price has been trading around 1.2150-1.22 for the last few days.
There isn't a certain date when Article 50 will be triggered, so market participants are waiting in anticipation. The low volumes are expected to continue until we have something on the table.
Main support is seen at 1.20 while main resistance is way up at 1.27.
Chart: GBP/USD H4

Wednesday, March 8, 2017
GBP/JPY Undecided
GBP/JPY has been trading in a narrow range for the last few weeks with price gravitating between 140 and 138. The pair got a a boost by strong US data released today, which drove investors to short-sell the Japanese currency and move over to the strong dollar.
Today, GBP/JPY reached a low of 138.40 and was supported by the fundamentals thus reaching an intraday high of 139.61. However, the move to the upside was short-lived as price has now retreated to lower levels around 139.30.
Main trend remains neutral and market participants would need to go above 140.50 or below 138.50 in order for a trend to begin a formation.
Chart: GBP/JPY H4

Tuesday, March 7, 2017
USD/CHF Range Bound
USD/CHF appears to be caught in a range
between 1.0140 and 1.0030. The pair has been consolidating since the
beginning of February, right after it ended a short lived move to the
upside going from 0.9870 to 1.0120.
The US dollar is now trading at 1.0116 for a Franc, again beating the Swiss currency on strong US fundamentals. The pair was below parity just for a few days before the US bulls took over and bought the dip.
Main trend on the short-term remains bearish with immediate target at 1.0140, a double bottom. On the long-term major bull target is seen at 1.0340.
On the other hand, if the US economy fails to provide data that meets the expectations, price will most certainly retreat to levels below parity with major bear target at 0.9850.
Chart: USD/CHF H4

Monday, March 6, 2017
EUR/GBP Met Resistance
EUR/GBP reached the resistance zone on Friday and is still consolidating in the same range. The Euro reached a high of 0.8642 against the Sterling and is now trading at 0.8627. The pair made a good move to the upside from 0.8421 in the end of February but now it is facing a strong resistance on the short-term at current market price.
If bulls manage to power through 0.8650 there is a great chance the rally will continue to a major bull target at 0.90 in the long-term.
If bears take advantage of the weak volumes indicating a market turn, the pair might end up depreciating to a major bear target at 0.84.
No major EUR/GBP news are scheduled for today, so we might see a continuation of consolidation.
Chart: EUR/GBP H4

Friday, March 3, 2017
ActivTrades: Enhanced Client Protection
One of the most important things you need to do even before you start to trade is to select your broker. The broker is your main source of quotes, charts, executions and access to the market. It's the entity that keeps your hard earned money and should provide you with secure and reliable service.
ActivTrades offers you just that. The enhanced client protection is based on three main pillars.
- Balanced protection - protection from a negative account balance, meaning you cannot lose more than your initial deposit.
- Segregated funds - your funds are safely held in a segregated client account.
- Additional security - insurance that allows protection of up to £500.000 capital in your account.
You receive all the benefits at no cost whatsoever. For more info, visit HERE.
Thursday, March 2, 2017
GBP/JPY In a Range
GBP/JPY has been going up and down for the past few weeks with price fluctuating between 138 and 142 for a Pound. The pair is now trading at 140.26 and appears to be caught in a narrow range between the support and resistance levels on the short-term.
First and immediate support is seen at 138.80 which is also a double bottom, second support line is seen at 136.40 and third level rests at 135. On the other hand, the resistance levels are R1: 141.00, R2: 142.75, R3: 145.00.
The future of the UK remains unclear as major political events are yet to unfold. They will serve as an indicator for future performance and will shape the expectations of the market participants.
If PM Shinzo Abe decides it's again time to devaluate the Yen, then GBP/JPY will continue on it's way up.
Chart: GBP/JPY H4

Wednesday, March 1, 2017
Gold Sells Off After Rate Hike Rumors
Gold price fell below $1,250 today in the early European trading hours after the Federal Reserve raised expectations for a March US interest hike rate. Gold reacted bearishly to the statement and fell to a low of $1,242 earlier today.
Now the precious metal is trading at $1,245 as market sentiment is turning from bullish to bearish.
Technically speaking, Gold was not able to overcome the 200SMA and the falling has been going on since Monday when it reached $1,263.
Major bear target on the short-term is seen at $1,230, while the bulls target the levels around $1,260 and above in order for them to continue on their path.
Chart: XAU/USD H4

Subscribe to:
Posts (Atom)