Monday, July 31, 2017

GBP/NZD At Decision Point

A few days ago this pair was analysed and we mentioned we were waiting for price to show a break out of the range and the 1.74400 support area for a shorting opportunity. Well we are currently still waiting, this is simply being patient for a potential opportunity. We are looking for a break retest of the 1.74400 support area for a shorting opportunity down to the 1.67430 support area.

If this pans out then we could short this market with a tight stop above support turned resistance and go for the 1.67430 area. The Pound is not looking very healthy recently and this could be a reason for market participants to stay away from the currency until more clear perspective is seen.

On the other hand, a rebound from current support would invalidate the shorting opportunity and lay the way for a bull target at 1.8279.
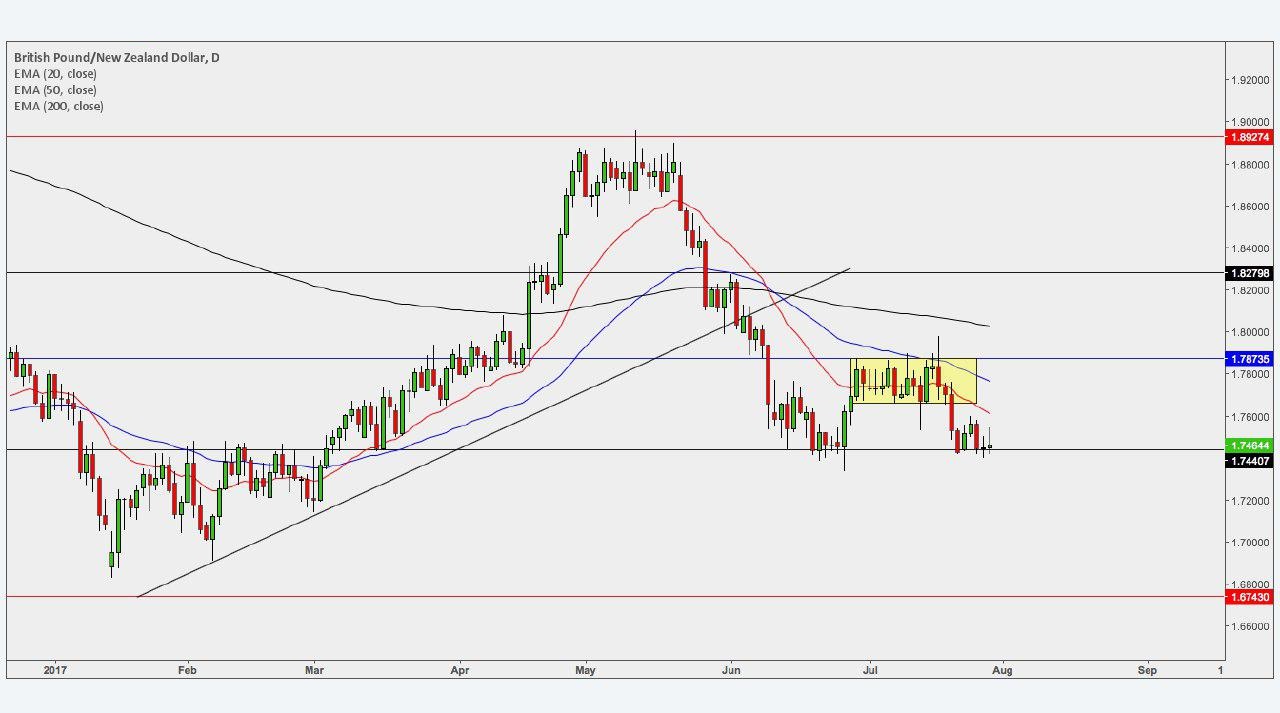
Chart: GBP/NZD D1


EUR/NZD Going South

So over the last week we have seen price in the EUR/NZD show a break of the small ascending trendline. Price on friday printed a shooting star rejection from the trendline, resistance and EMA's. We are now looking for price to break friday's daily low and continue bearish with the first target being the 1.54200 support. A break of the 1.54200 support and we will target the next support.

Major bear target is seen at 1.51400 and if that level is broken, then there would be an open path to the base of the Fibonacci retracement at 1.4580.

On the other hand, bulls might take advantage of the lower prices and buy in the Euro in a week full of economic data. The pair is worth monitoring this week as we have the NFP and Jobs report and that could have a big impact in every market.


Thursday, July 27, 2017

EUR/GBP Renewed Momentum

EUR/GBP has been trading to the upside lately. Price today is currently printing a bullish hammer. It might be early to go long the pair yet, it is preferable to monitor the pair to determine how this candle closes for a potential long market entry order up to the 0.91000 resistance area.

Price has recently shown a break out of the long term resistance of 0.888000, this is not quite a retest, however, this price action is currently signaling potential continuation to the upside. If the Euro maintains the momentum we might see the continuation sooner than later.

On the other side, having in mind how much of a rally the Euro posted, it might be considerable to expect a correction to the downside.

Chart: EUR/GBP D1


Wednesday, July 26, 2017

USD/CAD Consolidates

USD/CAD has been trading to the downside since the beginning of May when price was about 1.38. Ever since, the price has been depreciating as the US dollar went on a losing streak against all its peers marking more than a year lows against the most prominent as the Euro and the Canadian dollar.

As to the USD/CAD pair, the price reached a low of 1.2485 a few days ago and is now trading at 1.25. Main trend continues to be bearish as market participants are shorting the Greenback with no signs of stopping.

What could either speed up or put a hold on the momentum is today's Fed interest rate decision. The Fed is expected to hold the current rate at 1.25% so according to some specialists, this would be a non-event for the long term development of the USD index.

Still, have in mind that high volatility may cause panic in the market that could probably fade away shortly after the event is over.

Chart: USD/CAD H4


Tuesday, July 25, 2017

XAU/USD At Resistance

Gold has been trading to the upside for the past couple of weeks as price advanced from $1,205 to a high of $1,258. Recently the precious metal reached the resistance level right at its highest high and depreciated slightly since then.

Currently, Gold is trading at $1,252 and by the way is looks it will consolidate at current level until new developments stir the market.

Gold bugs are ready to take it higher should we see bad US reports this week that could hurt the growth of the US dollar. Above $1,260 which is seen as immediate resistance. Next bull goal is the $1,296.50 level which forms triple top. Above that eyes are on $1,340.

Chart: XAU/USD H4


NZD/CAD Breaks Support

NZD/CAD has recently broken the long term ascending trendline to the downside. We have seen price show a retest of this trendline and close rejection off the 20EMA with price now heading back south.

Our first target is the 0.91900 support, and if we see a break of this support then we expect to see price down at the 0.90000 round support level. 0.90000 is the long term bearish goal and it could be achieved if the strength in the Canadian dollar continues.

CAD has seen major improvement among the other currencies and market participants are favoring the advanced movement accordingly.

Should the CAD rally continue, then we might expect further depreciation not only in the NZD/CAD pair but also in USD/CAD and EUR/CAD.

Chart: NZD/CAD D1


Monday, July 24, 2017

GBP/NZD Down

GBP/NZD has been depreciating for the past few days as price has now retreated from its high levels and reached range bound trading. GBP/NZD price has recently been ranging in a box range. Price has shown a break out of the box range to the downside.

It might be too early to take a short position just yet, as it would be best to see a break-retest of the 1.74400 support for a short position. This would confirm a further breakout.

On the other hand, a bullish move to the upside would invalidate the possible downtrend scenario as price would have been brought back into the range 1.76.

No major news are scheduled for today for either sides so technical trading might keep the momentum going in the current direction.

Chart: GBP/NZD D1


Friday, July 21, 2017

SmartLines | Tool by ActivTrades

ActivTrades is integrating a brilliant tool to help you bring better results. It's called SmartLines and it's one of the best tools you can get your hands on. SmartLines works by automatically placing order the moment price reaches the line you have drawn.

This means that if you are a trend follower you can easily set up your trading channel and as soon as price reaches a line this would be your entry point. The tool is designed to save time and hassle in waiting and constantly monitoring price movement.

You can also set up stop loss and take profit prior to running the lines. In a few words, it does the work so you don't have to.

If you are interested, you can give it a try HERE.


Wednesday, July 19, 2017

USD Index Continues to Drop

Today we have seen price within the US Dollar Index show further weakness. Price yesterday closed with an inside bar which could have led to a retracement, however price today rolled over to the downside breaking through the -27.2% Fibonacci extension leading price down to -61.8% Fibonacci extension.

As you can see the -61.8% Fibonacci extension aligns closely with the 11990 support. The US Dollar index has been showing lower highs and lower lows for some time which is bearish market structure, until the market structure changes market participants could expect to see further bearish movement.

Today's positive US news did not leave a significant positive impact on the US dollar index and price remained relatively unchanged.

Chart: USD Index D1


USD/CHF Weakening in Price

USD/CHF has been trading to the downside ever since it dropped below parity level. As you can see price within this pair has been showing bearish market structure printing lower highs and lower lows. Most recent we have seen a lower low form at the 0.95500 area, with price since then retracing to the upside.

Price has so far retraced back to the 61.8% Fibonacci extension level, where we have seen several spikes and rejections. USD/CHF appears to be trapped in a small ascending triangle which is squeezing the price so that it will eventually show a break. All 3 EMA's are bearish and price is also capped by the 20EMA.

Over the next week, we will be looking for a break of the CTL (counter trendline) for a potential shorting opportunity down to the 0.94900 support which aligns with the -27.2% Fibonacci extension level. This would create a new lower low following the bearish market structure.

Chart: USD/CHF D1


Tuesday, July 18, 2017

USD Index Bearish Move Continues

An updated USD Index analysis shows how the US dollar has been performing since our last publication. On Monday we saw how price had been showing a retracement and that price was showing signs of printing a new lower high at the 61.8% Fibonacci level, which could have lead to a new lower low forming.

This has happened over the last week and we have seen price fall past the 0% level (previous lower low) and is sitting just above the -27.2% Fibonacci extension. At the 61.8% Fibonacci retracement we also had a rejection from the 20EMA which gives more confluence.

We are now looking for price to continue bearish with the next target being the -61.8% extension which aligns with the 11980 support area.

No major news are scheduled for today so we can expect price behavior to continue unbothered.

Chart: USD Index D1


UK100 At a Halt

UK100 Index seems to be exhausted since the latest rally and it looks like it's now taking a breather. Within the chart you are able to see that price has been retracing after reaching the 7600 area, which has lead price down to the 61.8% Fibonacci retracement level.

Price at this level ranged and went into a box range which today we have seen price show a break of, to the upside. A long position within this market could turn out to be early as of now, as we need to see further continuation above the counter trend line. If we see price show a break retest of the counter trendline then we will look to see if the risk to reward is good enough to take a long position up to the 0% Fibonacci resistance. On the other hand if the risk to reward is not good enough then a further break of the 0% area with a retest will warrant a long position. This is definitely a market which should be observed.

Chart: UK100 Index


Wednesday, July 12, 2017

EUR/USD At Resistance

EUR/USD reached the resistance level at 1.1480 earlier this morning after the pair posted fresh gains in the last week. The new high comes just before the testimony of FED Chair Janet Yellen, an event highly anticipated by traders and investors.

If the news turn out to be positive, then we might see a shift in trend from bullish to bearish. However, if the tone of Chair Yellen does not suit the market participants, we can expect the pair to break the resistance level and head for higher grounds. Price is now 1.1460, gravitating towards resistance.

Whatever the case, if you have an open position you might want to control your risk exposure by narrowing down on your trade or completely getting out of the market.

Chart: EUR/USD H4


Tuesday, July 11, 2017

USD/CAD Uncertain

USD/CAD is seeing times of high uncertainty as it approached the level of support at 1.2900. The US dollar did not react in any way to the NFP data that turned out higher than expected but at the same time the Canadian dollar appreciated rapidly in reaction to the positive CAD news.

The news release on Friday pushed the pair below long term support at 1.2920 as the pair made a low of 1.2859. This low, however, did not last for too long as USD bulls mustered up their strength and brought the pair back into the long term upward trading channel.

Currently, USD/CAD is trading at 1.2936, slightly recovered but still very fragile as it is just coming back into the channel. Having in mind that the USD is not showing signs of confident buying, we can expect the pair to continue depreciating.

Chart: USD/CAD D1


USD Index Bearish

This week has started off slow for the Dollar index after last week's bullish push from the bullish NFP data release. Yesterday the index has formed a very small candle which does show selling pressure.

Market sentiment is predominantly still overall bearish unless the market structure changes and we see a break of the descending trendline to the upside. Market structure is very important and shows clearly whether a market is moving bullish or bearish.

With price in the Dollar index showing lower highs and lower lows this is bearish market structure. If price does continue with the bearish momentum and continue from the 61.8% Fibonacci retracement then we will look for a potential new lower low at the confluence level of -61.8% area - 11980.

Chart: USD Index


Monday, July 10, 2017

Gold Backed by Support

Market participants are now having a difficult battle in attempts to win over the trend. The precious metal is seen to consolidate around the $1,209 level. The level also corresponds to the lower trendline on the medium term perspective. Also, the 50% Fibo level is exactly where price is now - $1,209. 

This means that the odds are in favor of the bulls. However, fundamentals show that the US economy is advancing and that lowers the interest in owning Gold. This is to show that the Gold market is at a make it or break it level. 

If price breaks the support and falls below the psychological level of $1,200, Gold bugs might retreat and give way to the depreciation of the precious metal. If the levels hold, this would be a strong start of the uptrend with major bear target in the range of $1,330-$1,350.

Chart: XAU/USD H4


USD/JPY Close to Resistance

USD/JPY is now trading close to resistance at 114.13. The pair made a high of 114.30, just a few point shy of the potential double top at 113.38. However, bears took control over it a bit earlier as it seems and lowered the price before the level was reached.

It's important to notice that the pair posted no gains on Friday when the expected jobs created in may were lower than the actual data.

If price remains below the resistance level we might see bears further depreciating the pair to first potential target level at 113.00.

On the other hand, a spike to the upside above 114.38 would invalidate the double top and open the way for further appreciation in the pair.

Chart: USD/JPY H4


Friday, July 7, 2017

EUR/NZD Headed Upwards

EUR/NZD has been trading to the upside for the past few days. As you can see price has been floating at the 1.57000 resistance where price today has currently shown a strong bullish push back to the upside.

The area of 1.57000 is a key resistance area. If price decides to show a break and retest of this resistance then market participants might be looking for a long position up to the 1.61800 area.

The 20 and 50 EMA's are very close together, which means they could also corss over and align bullish. It would be best to wait before taking a position in this pair until we see price show an actual break with a retest, however, its certainly a pair to watch the weekly close of and how price reacts at this resistance.

Chart: EUR/NZD D1


One to One Training | ActivTrades Education

As with any business anywhere, one cannot just start without any prior training and education. Trading any market, be it currency, bonds, stocks, commodities etc, requires a vast amount of knowledge, skills and insight.

This is why ActivTrades is hosting online coaching that trains you to be the trader you always aspired to be. ActivTrades experts will be delivering personalized training that is well suited to meet your experience and requirements.

The training will include instructions on how to use a trading platform, trading tools and how to explore different markets.

The training is free of charge and anyone can register. Don't miss the opportunity and sign up HERE.


Thursday, July 6, 2017

Gold Consolidates

Gold has consolidated around the level of $1,220. The precious metal started a downtrend since it reached just a few dollar shy of the psychological $1,300 a month ago. Currently, price is $1,223 and has just gone under the 200SMA, implying that the downtrend might gather new momentum and go further down.

First bear target is the 50% Fibo level at $1,208. As it seems, the psychological $1,200 level is bound to be reached. The event that could shift gears is tomorrow's NFP and Jobs' report data. If they turn out to be positive, then the $1,200 level becomes a probable target for market participants.

Below that, major bear target rests at $1,167. Should this level be reached, Gold would have returned all gains made this year.

Chart: XAU/USD D1


Wednesday, July 5, 2017

EUR/JPY Close To Resistance

EUR/JPY has been trading to the upside since the middle of the previous month as price advanced from 122.50 to today's high of 129.10. The bullish move came both due to the strengthening of the European currency as well as the weakness in the Japanese Yen.

Currently, price is resting at 128.66 as bulls are most likely gaining strength to push it up a notch to the resistance level at 130.00. This would be a good opportunity to go short the pair.

It is important to notice that lately the Euro has not been performing well against its peers and the chances of a last bullish wave to finish the move presents a major difficulty for market participants.

However, with today's FOMC Minutes we might just get what Euro bulls need.

Chart: EUR/JPY D1


Gold Breaks Support

As you can see, recently price has shown a break of the 1250.00 support area and the ascending trendline, as well as breaking onto the bearish side of the EMAs. This has lead price to have a large volatile drop today with price now being at the same level as the previous higher low point.

A break of this higher low point would show a daily lower low. Further continuation through the 1200.00 support level would warrant further shorting opportunities. A break and retest of the 1200.00 area would be a nice entry point for a short.

We must also take note that the 20EMA has now crossed over to the downside of the 50EMA which is another bearish confluence. If you are not in a position within this market, then keep watching for a potential break and retest of the round support at 1200.00.

Chart: XAU/USD D1