Tuesday, August 14, 2018

USD/CHF Consolidates

The USD/CHF pair has been heavily consolidated for the last month when the pair entered trading in the range of 0.9980 and 0.9850. The pair has gone out of the consolidation pattern twice, once to the downside with a low of 0.9787 and once to the upside with a high of 1.0066.

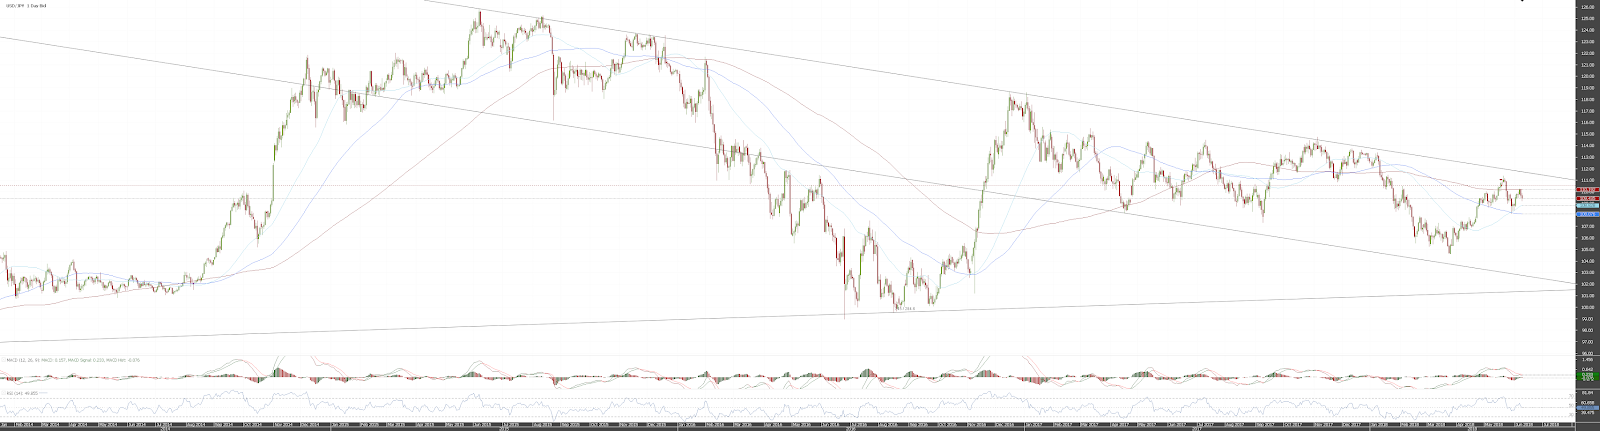
Currently, USD/CHF is back into the pattern and is trading at 0.9916. Market sentiment for the pair is neutral thus causing the pair to trade sideways without significant events or news that could shake the market and possibly give us a direction.

It's still undecided whether market participants will keep on buying the US dollar in light of its recent rally or they will choose the more stable Swiss franc.

Chart: USD/CHF H4


Silver Closing in on Support

Silver has been trading to the downside for the last month and moreover, it's been depreciating on the long term since mid-2016 when it reached a high of $21. The recent downtrend began in the middle of the last month at $17.30 and yesterday the precious metal reached the lowest low at 14.95.

Silver is now gravitating towards support level between 14.90 and 14.70. If those support levels are broken, 14.55 is seen as the next one and the major support is seen at the Dec 2016 low at 13.63.

Currently, the US dollar is having a rally against major peers and investors feel secure to divest of Gold and Silver for the highly regarded Greenback.

Following developments next month could give us key insights regarding the direction of the precious metals.

Chart: XAG/USD H4


Monday, August 13, 2018

Gold Moves Lower

Gold is trading below the psychological $1,200 level today as market participants boosted the price of the US dollar. Currently, Gold has recovered a bit and is trading at $1,201, with a low of $,1194 earlier today.

The depreciation in the Gold market is expected by market analysts as we are anticipating another rush to US dollars in the mid of strengthening US economy. If that is the case, Gold could go further down and test the lows all the way to $1,120 and, according to some, $1,000.

If, however, the US economy comes to a halt and the Greenback depreciates we could see a quick turn of events in the Gold market and a renewed interest in the safe haven.

Chart: XAU/USD D1


USD/JPY Backed By Support

USD/JPY went as low as 110.15 in the early trading hours of the European session today. Bulls, however, were quick to buy the dip as it just touched upon the support line on the medium term ascending trading channel.

Currently, USD/JPY is trading at 110.75, as the Yen is depreciating against major currencies. If the bulls could keep the momentum going, we could see first bull target at 112.30 this week.

On the other hand, Japanese bulls might not be yet ready to admit defeat and we could see the pair do another leg down below the support at 110.10. If that happens, major bear target will be seen at 106.00

Chart: USD/JPY H4


Thursday, August 9, 2018

Silver Moving Sideways

Silver is trading sideways today as it has been doing for the last three months. Currently, the precious metal is trading at 15.50 as it has consolidated in the range of 15.70 to 15.20. No major news are expected this week except manufacturing production, but this most likely will not have a direct and significant impact on the pair.

Silver needs to break either side of the consolidation before we can conclude a definite move. Short term trend is bearish to neutral while on the long term silver is performing in the negative territory, gravitating towards a one year low at 15.10.

In light of this, 15.10 is seen as major support to the downside and a good long entry, while resistance on the short term is seen at 15.70, which is the upped end of the consolidation pattern.

Chart: XAG/USD H4


Wednesday, August 8, 2018

GBP/CAD Making New Lows

The Sterling is having a rather bad week as the single UK currency is taking a beating by its counterparts. While a cheap currency might favor export costs, weakness in a currency is a sign of weakness in the economy.

So far, the Brexit hasn't been panning out nicely for the UK but this might change as new opportunities arise.

GBP/CAD is close to its lowest low which came as a post Brexit sell off result. The pair is now hovering around 1.6800 as the lowest low is waiting at 1.5767. If the UK economy continues to release weak data we could see the low levels again before year end.

Chart: GBP/CAD D1


Tuesday, August 7, 2018

CHF/JPY Consolidates

The CHF/JPY exchange rate has entered into consolidation on the medium term scale as the pair is now trading at 111.76. The exchange rate has been trading at a zig-zag pattern since mid July when the pair tried to break the 200SMA to the upside but was unsuccessful as traders took it down to the 50SMA at 111.46 and then back again close to the starting point at 113.15.

Bears seem to have taken control once again over the pair as it's moving down today from a high of 111.90.

Main bear target is seen at 110.00 - 109.80, while second and third targets rest at 108.48 and 107.68 which would both make double bottoms in accordance with previous lows.

Chart: CHF/JPY D1


Monday, August 6, 2018

Gold Sell Of on Hold

The sell off in the precious metal has been somewhat troublesome as Gold has been going through support zones and SMA levels without a sign of a halt. Currently, Gold is seen to be taking a breather from the steep downfall at its current market price of $1,210.

The precious metal dipped to $1,204 last week and market participants were quick to get their longs as it went right to the previous low made in July 2017.

The precious metal is facing a dilemma now whether to continue its short term trend to the downside or move up using the support level with increased momentum and trust. Some experts are already eyeing the $1,000 level amidst a stable US economy and healthy signs of growth.

Chart: XAU/USD D1


GBP/AUD Falls Below Support

The GBP/AUD pair is now trading below long term support as it broke the support level at 1.7733 which also collided with the 200SMA serving as another tool to sustain the upside momentum of the pair.

However, market participants were eager to sell the pair breaking both the 200SMA and the support line. Currently, GBP/AUD is trading at 1.7530 and it seems that it's going to go for the next support level at 1.7400 which would create a double bottom.

The Sterling is depreciating against all counterparts in the early trading hours of the European Monday session. No major news are scheduled for today so we could see a continuation of trading based on technicals.

Chart: GBP/AUD D1


Friday, August 3, 2018

ActivTrades SmartCalculator

Risk management is seen as one of the most, if not the most, important elements in trading. As any successful trader knows, preserving your capital is crucial to your survival in markets. This is why ActivTrades offers its clients a very useful and helpful solution for every trader, regardless of their level of experience.

The free tool is called SmartCalculator and it does a number of good things. You can calculate your expected return by setting a Take profit order and the allowed loss by setting a Stop loss order.

Basically, you write down your capital, choose a leverage and base currency and then enter the trade details - instrument, lots (goes to 0.01) and the position side - buy or sell. Then you insert open price, TP and SL and the system shows you important data as Pip value, potential gain and loss etc. It's definitely worth checking, for those interested just go HERE.


Thursday, August 2, 2018

EUR/CAD Sell Off

EUR/CAD has been trading to the downside for the past three days as the pair is going through a heavy selling wave. The short term momentum implies that the exchange rate will continue to trade lower as market participants are aiming towards the support level on the medium term at 1.5000.

The pair has other indications of a bearish market, namely the main moving averages and the fact that EUR/CAD is trading below them. Last week the pair went below the 200SMA and now the three of them, 50, 100 and 200SMA are gravitating above the exchange rate.

If EUR/CAD can reach the support level we could expect strong bullish reaction in the initial time as an attempt to buy at the bottom and potentially reverse the trend. On the long term, however, the pair is still making good bullish steps.

Chart: EUR/CAD D1


Tuesday, July 31, 2018

GBP/CAD At Support

GBP/CAD is now trading near short term support level at 1.7083. The pair went as low as 1.7060 before the bulls jumped at the chance and went long it. It's worth noting that the pair has not yet achieved a double bottom in accordance with the previous low at this level in the end of May.

It would be best to wait for a clear double bottom before opening long positions. However, chances are that this week is bound to be volatile-heavy for the pair as we are yet to see Thursday's news impact on the Sterling.

Bank of England will release the Inflation report along with the Interest rate decision which is expected to rise with 25 basis points from 0.50% to 0.75%.

Chart: GBP/CAD H4


USD/JPY Moves Up

USD/JPY is trading higher today as market participants sold the Japanese yen in the early trading hours of the Asian session. The Japanese yen is losing value against all major counterparts, namely USD/JPY, CHF/JPY and GBP/JPY.

The USD/JPY exchange rate is again above the resistance line on the long term downward trading channel. The pair broke the resistance in the beginning of July and then briefly dipped below it again just to rise above.

This time the breakout seems stronger and the bull camp determined to keep the fire going. It bulls manage to sustain the momentum we could see USD/JPY go to first target at 113.20 and onward to new horizons.

Chart: USD/JPY D1


Monday, July 30, 2018

NZD/CAD Backed By Support

NZD/CAD reached the support level last week during the early hours of the US trading session on Friday. The pair went as low as 0.8830 and was supported by market participants to levels beyond 0.8870.

The pair is seen to consolidate between two narrowing lines of support and resistance on the long term. If bears can get a break below 0.8750 this would indicate a new leg down that could turn into another medium term downturn.

On the other hand, if bulls get the strength to push the pair up, we could see a break above 0.9400 which would invalidate the medium term bearish trend and create opportunities for levels not reached since late 2016 early 2017.

Chart: NZD/CAD D1


Friday, July 27, 2018

CHF/JPY Moves Lower

CHF/JPY is trading down this week as the pair moved from its high of 113.24 on July 17 to yesterday's low of 111.50. The pair is now gravitating towards the lowest point reached yesterday, currently trading at 111.64.

If bears continue to pressure the pair they may persuade the bulls to give up for a while until first support level on the short term is reached at 110.60. Second support is seen at 109.50.

On Tuesday next week the BoJ will hold a press conference and announce the updated monetary policy statement. The event will be anticipated by traders and thus it is very likely that CHF/JPY will be affected in either ways.

Chart: CHF/JPY H4


Gold Consolidates

Gold is now trading at $1,224, it appears that it will close the week with little to no change. Gold opened trading around $1,228 on Monday and went as low as $1,218 on Tuesday morning. Market participants seems to be holding onto the safe haven asset without any expectations to turn a quick profit.

The stagnation in price is due to no attention to the market this week as we are light on events and happenings that can cause volatility and assets to change hands.

Next week, however, the schedule is tight with news releases coming out of Japan, the European union, the United Kingdom and the US. Traders and investors are expecting prices to go on their usual swing during such market movers and Gold will not be on the sideline.

Chart: XAU/USD H4


Thursday, July 26, 2018

EUR/JPY Moves Higher

EUR/JPY has been trading higher for the past few weeks as the pair reached 132.00 some ten days ago and is now gravitating towards 130.00. The exchange rate made a triple bottom on the short term time span with the latest low being the third point serving as a catalyst for the bullish camp to initiate buying.

Whether the third inflection point will hold will become clear once the rate passes the resistance zone at 131.34 and 131.50. Stronger resistance on the short term is seen at latest high at 132.00.

EUR/JPY is in a strong upward move for the last two months going from a low of 124.67 to a high of 132.00 with only two corrections and almost no consolidation.

Chart: EUR/JPY H4


USD/CAD Breaks Support

USD/CAD is trading lower today after it broke the support line yesterday in the early European trading hours. The pair went from 1.3150, which was seen as the short term support zone, to today's low of 1.3025.

Currently, the pair has improved a bit and it's trading around 1.3040. The short term trend remains bearish as market participants are eyeing next support level at 1.2940-1.2910.

This week has no significant US or CAD data and therefore we might expect the pair to trade sideways to negative.

Long term trend remains strongly bullish as price is in an uptrend for the past 3 years.

Chart: USD/CAD H4


Wednesday, July 25, 2018

USD/CHF Drifts Lower

The USD/CHF pair is hovering around the support level at 0.9950 to 0.9910. Recently, the pair has been trying to break the parity level to the upside but so far attempts have proved to be unsuccessful. The exchange rate reached 1.0037 last week only to give in to bearish pressure and move lower.

The pair is now at inflection point when market participants need to decide whether it breaks the support at current market price or it pushes higher based on technical for the lack of strong fundamentals.

This week is low on fundamentals, so if there isn't a strong enough drive for technicals, the pair could be expected to consolidate until significant US news shake the market again.

Chart: USD/CHF H4


Friday, July 20, 2018

ESMA And Overcoming Restrictions for EU Traders

The ESMA (European Securities and Markets Authority) recently ruled out an update regarding the protection of investors and implementing new regulations and restrictions for brokers. In March this year, ESMA introduced leverage restrictions for CFDs and prohibited any type of binary options involvement to European clients.

These restrictions play a big role in the development of brokerage services in the EU. The maximum leverage European brokers are allowed to offer is now 30:1 on major currency pairs and CFDs and 20:1 for Gold and non major currency pairs.

The new rules came as a surprise to retail traders and brokers sought to offer a way to overcome the measures implemented by the ESMA.

ActivTrades is ready with two solutions. The first one is to open a professional account. In order to do that, a client must be eligible by covering three necessary criteria. You can check it out HERE.

The second solution for retail traders is to open an account in the Bahamas. The legislative framework there is suited to accommodate clients from abroad and they will still have the option to choose higher leverage and better conditions. You can check it out HERE.


AUD/USD At Support

AUD/USD reached the support level earlier today in the pre-opening hours of the European session. The pair went as low as 0.7327 and then immediately pulled up as traders and investors sought to catch the double bottom.

The exchange rate is now 0.7367, slightly higher due to technicals, less so fundamentals. Both parties are event-free today, meaning we may be in for a calm and smooth trading activity at least in this pair.

If bulls are able to hold on to the buying wave and sustain momentum we might see first resistance level at 0.7520 next week. On the other hand, a break out of the support level would indicate bearish dominance.

Chart: AUD/USD H4


Wednesday, July 18, 2018

Gold Moves Down

Gold prices plummeted to new lows yesterday as the precious metal reached a low of $1,222. The safe haven asset was hovering around $1,240 yesterday before the sell wave occurred in the mid hours of the US trading session.

Gold broke the long term support zone that held the precious metal in an uptrend and now it seems price is headed to a double bottom at the psychological $1,204 level.

The upward trending channel that started in the end of December 2015 at the low of $1,047 is now invalidated and Gold bugs might be scared to go long. The spin off is yet to occur and we are yet to see how this will play out in the minds of money managers and market participants.

Chart: XAU/USD D1


Tuesday, July 17, 2018

USD/JPY Above Bearish Channel

The US dollar has been strengthening against the Japanese Yen for the past few months. Starting in March, the USD/JPY exchange rate went from 104.00 to last week's high of 112.78. The long term bearish channel was broken last week at 111.00 and now the pair is painting a new beginning.

Above bearish pressure, the pair is now exposed to new highs starting with first resistance at 113.50. If that level does not break, we will see a double top with the last high before the final slip to latest low.

This week is packed with significant news as we have two testimonies by Fed Chair Powell on Tuesday and Wednesday as well as Building permits and Philadelphia Fed Manufacturing Index.

Chart: USD/JPY D1


Monday, July 16, 2018

GBP/JPY Higher

The GBP/JPY pair is trading at 149.00 as it has been on an uptrend since the beginning of July when it was below 145.00. The Sterling is seeing some inflows of capital as traders and investors saw an opportunity to buy at low levels due to economic uncertainties and political spats.

If the pair continues on its uptrend, we could see it reach the resistance level which falls at 150.00. This would mark the third touch of the downward trading channel started in early February this year.

Technically, the pair is still in a downturn and it will take some muscle to break through it. If we can get passed the resistance at 150.00, bulls might pour in new capital to fund the continuation of the appreciation of the Sterling against major currencies, JPY included.

Chart: GBP/JPY H4


Friday, July 13, 2018

USD/CHF Breaks Parity

The USD/CHF pair broke the parity level today as it went as high as 1.0068. The US dollar strengthened against major currencies and we saw Gold and Silver go down in value. Currently, the USD/CHF pair is trading a little lower at 1.0049 but a sudden move to the upside is not out of the picture.

The highest high was a test of the double top as the first one was reached in early May this year. So far the level has been holding up strongly and we have not yet broken out of it.

If the bear camp decides to sell on the bounce we could expect the exchange rate to reach below the upside trading channel at 0.9980. On the other hand, a break out of the double top could result in a continuation of the bullish trend with first target at 1.0100.

Chart: USD/CHF H4


Thursday, July 12, 2018

USD/CAD Upside Momentum

The US dollar has been strengthening against major currencies, most obviously to the Canadian dollar. The USD/CAD pair reached a high of 1.3380 at the end of June and is now trading around 1.3200. The exchange rate has been trading steadily to the upside since the beginning of the year when it was floating around 1.2250.

The strong momentum is both due to fundamentals and technicals. Fundamentally, the pair has been enjoying solid support by strong US economy, low unemployment data and raising rates.


Technically, we had a few successful support level tests during the year which boosted the pair to its highest high.

First support level is seen at 1.3100 while first resistance level is seen at 1.3380.

Chart: USD/CAD H4


Wednesday, July 11, 2018

USD/CHF Consolidates

USD/CHF has been consolidating around parity level. The pair is now trading at 0.9946 and it seems ready to re-test the previous high of 1.0050. If that level is broken, we could see another leg to the upside with potential target at 1.0350.

The US dollar has been strengthening lately and traders and investors are pushing aside other currencies like the Euro and Sterling as well as safe haven assets like Gold and Silver.

This rush to the Greenback could be the result of easing the tariff tensions and bringing back the certainty and optimism to the US economy. However, it is still early to draw the line and go long equities and US dollars so it would be best to wait for more clarity and mutual agreements between the US and China.

Chart: USD/CHF D1


Monday, July 9, 2018

Gold Higher Amidst Trade Concerns

Gold is trading higher in today's session just less than an hour before the opening of the US session. The precious metal went to a high of $1,265 earlier today and gave away some its gains to currently trade at $1,263.36.

Gold reached a strong support level on the long term at $1,237 earlier this month and market participants quick to get a hold on to the safe haven as trade concerns started looming last week.

If Gold continues on its way north, we can expect to see first resistance level at $1,280. If that level is broken, second resistance level is seen at $1,310 - a double top after the psychological $1,300 level.

This week is lighter on events and so we can expect smooth sailing based predominantly on technicals.

Chart: XAU/USD H4


EUR/JPY Moves Higher

The EUR/JPY pair broke the resistance level at 130.00 and is now trading at 130.20. The pair is trading in a short term bullish direction but still remains pressured by bearish sentiment in the medium and long term perspective.

As trade fears become a significant factor in the financial markets stage, traders are turning from the unsafe US dollar to its major counterpart the Euro and the all time safe haven asset - Gold.

EUR/JPY moved from a low of 124.65 to its current high in a bit more than a month and it's now beyond the bearish resistance. If it continues to trade to the upside we can see a double top at 133.50 before long.

Chart: EUR/JPY H4


Saturday, July 7, 2018

EUR/AUD Rally Consolidates

The EUR/AUD pair has been trading to the upside for the past month and only this week it came to a temporary halt as market participants have been agreeing upon the price. The exchange rate is currently floating around 1.58 and is trading in the range of 1.5900 and 1.5750.

It is still unclear whether the pair will continue on its course north, and if it does, we can expect to reach the short term resistance zone at 1.60.

On the other hand, a sell off in the Euro could lead to potential short term correction with major target at 1.5450. No matter what, we can expect a breakout and then draw conclusions.

Chart: EUR/AUD H4


Friday, July 6, 2018

Trend Lines and Channels | ActivTrades Webinar

ActivTrades is presenting another great opportunity to learn. This time they are hosting a webinar focused on trend lines and channels. As you probably know, trend lines and channels are one of the most important components of the technical analysis.

Without trend lines, any asset would be floating freely in space without making any sense. In markets, as in nature, everything works in perfect order. And this is where trading channels come into play.

The webinar, led by trading expert Martin Walker, will be entirely devoted to explaining trend lines and channels thus helping you make better trading decisions ultimately giving you a better trading performance.

The webinar is free and will take place on July 10. For more info and free registration, visit HERE.


USD/CHF Drifts Up

USD/CHF has been moving to the upside for the last month marking a choppy trading behavior from 0.9790 in the beginning of June to 0.9918 made last week. The pair is now trading at 0.9925 right at the support line that took place in the end of March.

The pair is now testing the support line and if we have a confirmation, bulls will initiate another buying wave to possible first target of 1.0037 or at least the psychological level of parity.

It is still not clear whether the support will hold as we are yet to see the latest NFP and Jobs data later today. If the data is negative, bears will most certainly sell a significant amount of US dollars thus breaking the support line. Until the data release, consolidation might be expected.

Chart: USD/CHF H4


Tuesday, July 3, 2018

EUR/NZD Moves Down

The EUR/NZD pair reached a new high today at 1.7375 and a few moments later it was taken over by the bearish camp. The exchange rate is now trading slightly below 1.7300 and it seems that after the long bullish run a bearish correction is at hand.

The pair moved strongly to the upside in the past two weeks, in mid June it was trading at 1.6600 and had only two days in the red up until today.

It is worth noting that indicators signal the bullish run still has fuel in it as we are above the 200SMA and MACD continues to remain bullish.

A short correction, however, could be healthy for the progressive and steady move to the upside.

Chart: EUR/NZD D1


Gold Supported at $1,236

Gold is trading higher in today's session as the bearish camp got exhausted by selling and Gold bulls took things in control. The precious metal reached a low of $1,236 and shortly after, Gold reacted to the upside by a strong tick to a high of $1,246.50.

Gold reached a strong support in the long term as the lowest is actually a third touch point of the upward trending channel that started in December 2015 at $1,046.90. If there is enough buying pressure we can see Gold go for a prior pivot point at $1,290-$1,300.

On the other hand, we are still in a bearish trend started at $1,360 and a break out of the bullish trendline would be a strong sign of a continuation of the bearish run. Below $1,235 there is a lot of room to go.

Chart: XAU/USD D1


Friday, June 29, 2018

EUR/USD Higher

The EUR/USD pair is trading higher in today's session just a few hours before the opening of the US trading session. The pair reached a low of 1.1530 yesterday and since then it's climber up to 1.1653.

The pair is still in bearish trend as it would take strong EU fundamentals in order to break the predominantly bearish sentiment over the pair.

First bull target is seen at 1.1712 which would mark a double top on the short term. Second bull target is seen at 1.1900 and major target is the breakout of the bearish trend at 1.2250.

No major news are scheduled to today so we could see mostly technical trading.

Chart: EUR/USD H4


Thursday, June 28, 2018

Silver At Support

Silver has reached the shore at 16.15, the long term support of a trend that started in the end of 2015. As the precious metal is testing the support now, market participants are eagerly waiting to see whether it will break it or bounce off of it.

It's worth noting that the precious metal has already gone below the most important SMAs - 50, 100 and 200. And now it's being held by immediate support. If Silver breaks the 16.00 level we would have a confirmed breakout and a potential continuation of the downfall in price.

There are no major US news coming out this week so market participants would more likely be focused on technicals rather than fundamentals.

Chart: XAG/USD D1


USD/CAD Close To Resistance

USD/CAD has been trading to the upside for the first half of this year as we saw a massive move north starting in the end of January. The pair was trading at 1.2250 at its lowest for the year right before it started its way up.

Currently, USD/CAD is trading at 1.3300 as market participants are still optimistic about the strengthening of the US economy.

Bear in mind that although the strong US fundamentals paint a rather pretty looking picture, the market is moved not by past events and scenarios but by the hopes and fears of the market players. In this light, it pays to be cautious in times when others are greedy.

Chart: USD/CAD H4

Wednesday, June 27, 2018

GBP/USD Consolidates

GBP/USD reacted sharply to the upside last week when the news broke out that the BoE is keeping the rates unchanged at 0.50%. The pair reached a low of 1.3103 on Thursday last week and in the same day moved some 120 pips higher.

The highest high was seen the next day when the Sterling went to 1.3316 and since then the pair has been depreciating.

Currently, GBP/USD is trading at 1.3211 as speech of BoE Gov Carney is minutes away. It could be expected that the pair could swing both ends as we are still unsure whether the BoE would present a dovish or a hawkish outlook on the UK economy.

Chart: GBP/USD H4


Gold Sell Off

Gold has been trading sharply to the downside since it's peak of $1,365 in mid April. The precious metal reached a new low in the early trading hours today when price dipped below the support level at $1,255 going to a low of $1,253.

The main trend remains bearish for the time being as we would need a strong buy signal, most likely ignited by weak macro picture. As the European market and the US market are witnessing redemptions, we could expect some of the money to be allocated in the Gold market.

Main target for the bear camp is $1,235, whereas bulls are eyeing the levels above $1,280 in order for the trend to be considered bullish.

Chart: XAU/USD H4


Friday, June 22, 2018

SmartPattern by ActivTrades

ActivTrades designed an easy to use powerful indicator to help you in your trading game. The indicator is called SmartPattern and it is made to help you look beneath the surface and see how the markets create patterns that can be used to improve your trading results.

SmartPattern can help you analyze any market in any time frame and what it does is it detects chart patterns and detailed statistics.

Based on technical analysis, the SmartPattern tool can save time, effort and eliminate bias in your trading judgment.

It's available for ActivTrades Live clients and is completely free for unlimited time. For more info, visit HERE.

Wednesday, June 20, 2018

GBP/USD Halts at Support

The GBP/USD pair registered a sharp drop last week as price went from 1.3430 to 1.3200. The pair has been depreciating since it reached the double top toward the end of April this year. The bearish trend looked like it was exhausted but market participants thought otherwise as the pair continued its way south last week.

GBP/USD will need a strong push to the upside in order to recover the losses incurred in the last two months.

If it dips below 1.32 again we could see it drop below the 0.618 Fib level which stands at 1.2983. Until then support is 1.32 and resistance is seen at 1.3491.

Chart: GBP/USD D1


Tuesday, June 19, 2018

Gold Goes Down

Gold was trading to the upside last week when the precious metal made a 1-month high going above the 200SMA to a high of $1,309. The gains, however, were short lived and ended right after the US dollar decided it's time to continue its rally.

Currently, most market experts are bullish on the US economy despite raising rates. Financial magnates like Julian Robertson and Paul Tudor Jones are expecting the rally in the stock market to continue at least until the end of the year. Paul Tudor Jones even called for a "crazy" stock market toward the end of 2018 along with rising bond yields.

Given how colorful and optimistic the second half of the year looks, traders and investors seem to be drifting away from any safe havens, namely Gold and Silver.

One thing is certain, as volatility is back in the markets we are to see a wild half of the remaining year.

Chart: XAU/USD D1


Monday, June 18, 2018

USD/CHF Moves North

The USD/CHF pair erased most of the losses it accumulated in the previous weeks due to a very dovish statement by Mario Draghi, the ECB chairman. The Swiss franc was right after the Euro on the depreciation line as both suffered massive sell offs.

Market participants weren't optimistic about the statement by Mario Draghi and flew to the US dollar for safety among the political uncertainties in Europe.

The USD/CHF pair closed very close to parity on Friday and we are now yet to see whether the uptrend will continue and break parity or traders and investors will put selling pressure on the dollar and bring it back below the 50SMA.

Chart: USD/CHF D1


Euro Weakens

The EUR/USD pair weakened with more than 300 pips on Thursday and Friday last week as Mario Draghi entered the market with dovish comments. In his press conference he addressed the question about raising rates and according to the ECB, the earliest we could see European rates raise will be the summer of 2019.

This statement was registered by the markets as a reason for a sell of in the single European currency and the Euro went from 1.1850 to 1.1543 against the dollar.

The sell off was also felt in the Swiss franc as it lost close to 200 pips going from 0.9820 to 0.9980, very close to parity.

The market sentiment on the Euro remains bearish and if we can break the level of 1.1550 we could see another leg down to 1.1300.

Chart: EUR/USD D1


Wednesday, June 13, 2018

USD/CAD Reached Resistance

Strong resistance is standing in the way of the US dollar against the Canadian dollar. The pair reacted bearishly to Friday's trading as market participants pushed the pair to the resistance level at 1.3030. The long term downward trend that started in the beginning of January is still intact.

The pair needs to break 1.3100 in order to invalidate the bearish sentiment. If bears, however, put more pressure to the downside we can see the exchange rate go to the SMAs which are now hovering around 1.2800 - 1.2600.

Fundamentals will most likely play an important role in the pair's future as we are yet to see the unfolding of the trade tariffs impact on the market.

Chart: USD/CAD D1


Tuesday, June 12, 2018

GBP/JPY Climbs Higher

The GBP/JPY pair climbed to levels close to the major SMAs in the first days of last week as the pair approached 148.00. Nearing the end of the week the pair gave away some of the gains made in the beginning but still was able to sustain the price above 146.50.

The pair reached a strong support on the long term scale at 143.50 and bulls reacted strongly to the opportunity. If the bullish trend on the short term continues, we can expect to reach the first SMA - the 50SMA and then the other two almost simultaneously as they are all very close to each other.

First bull target will be to take the 50SMA and possibly break the double top at 150.00.

Chart: GBP/JPY D1


USD/JPY Reached 200SMA

The USD/JPY pair traded right below the 200SMA on Thursday and Friday last week as bears took control over the pair and pushed price down to levels below 109.50. The pair is now in between the major SMAs - 200, 100 and 50.

We can expect the bearish trend to continue as we as seeing a slowdown in the US economy and looming trade concerns.

Bears can attempt to push the price down to levels below the 100SMA which falls at 108.07. If that happens, their major target would be to get to the lower trend line of the long term downward trade channel at 102.40.

Chart: USD/JPY D1


Monday, June 11, 2018

USD/CHF Takes a Break

USD/CHF has been depreciating since it reached a double top last month at 1.0050. The pair had to take a few days of consolidation before breaking to the downside and confirming the double top.

The pair closed the week hovering around the 50SMA at 0.9860. A rapid pullback was registered on Friday afternoon European time and the pair jumped from 0.9790 to 0.9890. After that buying pressure eased a bit and the pair traded with normal volumes again.

If the downtrend continues we can expect the pair to reach the 200SMA which falls at 0.9714 and see if bulls try to take over at that buying opportunity.

Chart: USD/CHF D1


CAD/CHF Stops at 100SMA

The CAD/CHF pair closed the week gracitating towards the 0.7600 level. The pair has had some massive intra day swings making it almost impossible to day trade because of the unpredictable and rapid movements.

However, on the short term the pair still looks bearish as price has retreated from its high of 0.7870 and reached a low of 0.7535.

If the bearish trend continues, we can expect the pair to reach main target at the long term support zone of 0.7300. That level would act as a strong support if reached and we can expect a pullback once there.

Chart: CAD/CHF D1


Friday, June 8, 2018

Candlesticks Explained | ActivTrades Webinar

Candlesticks are one of the main tools that should be taken into account when you develop your trading strategy. They are important for a few reasons and in many ways.

They can be used to read the behavior of all the market participants into one single embodiment. They have a few important elements like open price, close price, high and low.

They can be used to spot and track technical patterns, which are the most important thing in trading to some expert traders and investors.

ActivTrades is holding a webinar on 12th June designed to shed light on this important trading tool. The event will be hosted by Martin Walker, trading expert. It's completely free to watch and can be found on THIS LINK.

Do not miss this opportunity to learn more about candlesticks!


Tuesday, June 5, 2018

USD/CAD Close to Resistance

USD/CAD closed the week behind us just a few pips shy of 1.30. The pair reached a high of 1.30 during the NFP release and due to the strong number that we got it, the US dollar surged. The rally was short lived as just minutes after the initial jump, most of the reaction has subsided.

The pair is now close to the long term resistance as it approached the upper trend line of the long term downtrend trading channel that started in the beginning of 2016 when the pair was trading close to 1.46.

The price is now gravitating towards the 1.30 level and if bulls are able to break the resistance at 1.3050 we could see a renewed interest in the long side of the exchange rate's trading.

Chart: USD/CAD D1