Monday, October 31, 2016

GBP/CHF Consolidating

For a while now GBP/CHF has been consolidating at a support level around 1.2000-1.2100. The pair seems to have reached a level where market participants need to decide what to do next. On the one hand we have GBP bears that witnessed the latest flash crash on Oct 7 when the Sterling went down 6% only to recover more than half. The drop came as a surprise when volume traded was at a very low level. GBP/CHF from 1.2381 to a low of 1.1606 and a few hours later was 1.21. 

Since then, the pair has been trading sideways well below the 200SMA and dangerously playing with the support level. Bulls, on the other hand, will need massive action if they want to see prices soar. They have no advantage as we know how fragile the UK currency currently is, moreover, the pain from leaving the EU is yet to be felt, which could dramatically worsen the performance of the Sterling. 

A good position, either long or short, would be one with a tight stop somewhere in the range of 1.19 and 1.22. 

Chart: GBP/CHF D1


Friday, October 28, 2016

Financial Trading Summit 2016 by ActivTrades

ActivTrades is hosting a big big event next month. The UK based broker has been very busy recently in preparation of the Financial Trading Summit 2016. The event will take place on the 19th of November from 9:30 to 17:30 in the 5-star May Fair Hotel in London.

There would be a lot of guest speakers, active traders, mentors, analysts etc. Trading experts will share their styles of trading, insights on how to master your psychology as a trader and much more. 

This would be the best place for you to make new connections and create a network with other traders. 

If that's not enough, ActivTrades is giving away access to all of the participants in a two-week online course worth GBP495.

The event is absolutely free. To check the programme, speakers and to register click HERE.


Thursday, October 27, 2016

USD/CHF Consolidating

USD/CHF continues its sideways trading in today's early European trading hours. The pair has been in consolidation for the past few days gravitating towards 0.9910-0.9940. The pair looks a bit exhausted as there isn't anything that could create volatility. However, later today we have important US data, USD Durable Goods Orders, that may give the pair the needed boost in either directions.

The pair did reach parity, or at least as close as it gets to parity, when USD bulls pushed the price to a high of 0.9998 and then retreated to lower levels. Current market price is beating yesterday's close but it's still not enough to give any impulse to the upside.

If the news are positive then we might see a break above parity, but if they fall below expectations, bears will take advantage and quickly turn the trend in the opposite direction.

First resistance is seen at 1.00, first support is seen at 0.9810.

Chart: USD/CHF D1


Wednesday, October 26, 2016

AUD/CAD Rallies

The Australian dollar has been witnessing good vibes recently, especially today when the news turned out to be in favor of the single currency. AUD Consumer Price Index came out better than expected at 1.3% vs forecast of 1.1%. The event played a significant role in every AUD pair, but the most effect was felt in AUD/CAD where the pair went from 1.0196 to 1.0286.

AUD/CAD has been trading above the resistance for the past week and now with the positive data it may try to reach the next level at 1.0500. If the bulls sustain momentum, AUD/CAD may even break the resistance line and go for the multi year high at 1.0800.

On the other hand, bears may try to turn the trend at 1.0350 and depreciate the pair to lower levels. As a start, they need to get back into the downtrend channel and then below the 200SMA. Major bear target is seen at 1.09140.

Chart: AUD/CAD D1


Tuesday, October 25, 2016

USD/JPY Higher

USD/JPY is trying to break out of the range trading in which it's been caught for the last three weeks. The pair made a good bullish rally in the end of September going from 100.08 to 104.16 but since that high things have been very difficult for the bulls. USD/JPY entered into consolidation and for the month of October it has been trading between 102.80 and 104.40.

Currently, USD/JPY is trading at the high end of the range at 104.41 and it appears that bulls may try to break out and close above the last high of 104.63. Main trend for the long-term remains bearish, but the bottom looks very stable indicating that a trend change is likely happening now.

If bulls get a close above 104.70 this might be the beginning of a new rally to the upside with first potential target at 107.50 and major target at 110.

Until then, USD/JPY has to break current resistance and if not, then bears have first target of 103.54 and then they need to get back to the downtrend below 102.

Chart: USD/JPY D1


Monday, October 24, 2016

USD/CAD At Resistance

USD/CAD is trading relatively unchanged since Friday's high after the pair got a boost when the CAD news were released. USD/CAD made a high of 1.3354 on Friday and closed at 1.3333. Today, the pair has been trying to hold to the gains from the past week and has been successful so far. USD/CAD made a new high today at 1.3358 but then retreated to lower levels below 1.3340. Main trend on the short term is bullish, the thing is that if bulls want to continue with the same pace they have to get above the resistance at 1.3350-1.3355.

That's the hard part as they have to rely on Friday's news and momentum because today we have no news coming out.

On the other hand, US Consumer Confidence is scheduled for tomorrow morning Eastern time and that may be another boost in the pair's price.

Until then, USD/CAD is trading with low volumes at current market price of 1.3335.

Chart: USD/CAD D1


Friday, October 21, 2016

USD/CAD Continues Sideways Trading

USD/CAD is yet again trading up and down day in and day out. The pair has been caught in range trading since it hit the bottom in early May after it made a history high in the end of January. January high of 1.4689 came as a surprise for most traders and investors as it was beyond any prior resistance and bull target. Since then, USD/CAD took a nosedive that lasted three months and cost the pair some 220 points going from 1.4689 to 1.2460.

Since May, USD/CAD has been very difficult to predict as the pair has not been going much but sway from 1.32 to 1.27. Lately, however, the pair has been playing with the 200SMA indicating that a time to move has come. 

Current price is 1.3245 with a high of the day of 1.3250. Market participants are anticipating today's CAD CPI and Retail Sales.

Chart: USD/CAD D1


Thursday, October 20, 2016

Gold Looking Ill

Gold has been having a tough time recently. It's clear that the precious metal is struggling to hold the gains made during the year but as time progresses towards the end of the year, Gold has been neglected and has been losing its value. The downmarket started from the high of $1,375 on 11 Jul and now a hundred dollar cheaper Gold is trading at $1,270 with a low of $1,241.

What is more worrying is that the last gains have come to pass with great difficulty and if today we close at current or lower price, there is a great chance of a drop tomorrow and the next week. The price is gravitating towards the 200SMA which indicating that a movement in either directions is likely to occur. First support is seen at the last low, while major bear target is of course the psychological and long awaited $1,000 level.

However, Gold has had an amazing year with more that 30% rise, beating almost all of the other markets.

Chart: XAU/USD D1

Wednesday, October 19, 2016

USD/JPY Hesitating

USD/JPY has had a good bull run that came as a surprise when market participants expected the Abenomics (economic policies advocated by Shinzo Abe) to continue to lift the Yen against its peers. However, the Yen reached a low of 100.08 and then reacted to the upside thus confusing USD/JPY bears.

The rally came short when the pair reached a high of 104.63 which does not coincide with any of the resistance levels. Now the price has retreated to lower levels and the pair is currently trading at 103.49 with a low of 103.41.

Main trend on the long-term remains bearish, but what is interesting is that the pair had had three strong bounces off the support line at 98.95, 99.54 and the latest - 100.08. In order for the bearish trend to continue, bears must get a close below those levels.

On the other hand, bulls may have the easier task as the have some momentum with the recent rally. They may be able to reach the 200SMA at 107 before year end.

Chart: USD/JPY D1


Tuesday, October 18, 2016

AUD/USD Higher

AUD/USD is trading significantly higher in today's session after yesterday uncertain behavior. The pair reached a high of 0.7685 and is now trading at 0.7682. The pair looks very bullish considering the latest rally from 0.68 to 0.7755.

Yesterday's trading was indicative that AUD bulls are not giving up on the ideal to see the Australian dollar gain strength, Bears were unable to pull the price down not for the lack of trying but for the heavy pressure from the bull camp. The pair went to a low of 0.7580 and then started moving higher.

Now we are at minor resistance as this would be the fourth time to attempt a break out at 0.77. If bulls are successful in this endeavor we can be hopeful that AUD/USD is on its way to conquering higher levels with major target at 0.8550.

Chart:
AUD/USD D1


Monday, October 17, 2016

EUR/USD Shows Signs of Recovery

EUR/USD is trading higher in today's early European hours. The pair was exhausted from the fall that occurred in the last couple of weeks going from a high of 1.1280 to a low of 1.0964. Currently, price is 1.0986 with a high of 1.0994. The Euro remains weak and the trend seems to be strongly bearish, suggesting that the continuation of the move is likely to proceed. 

The downmarket is a good opportunity to go long if you are able to buy the dip, although major banks' forecasts suggest that the Dollar would continue to gain strength until the end of the year. If the FED actually raises rates this would be another milestone that would play a significant role in the appreciation of the US currency.

Until then, the pair remains in the bearish camp with first support seen at the last low and major support at 1.09. On the other hand, first resistance is seen at 1.10 and major resistance is seen at 1.1057.

Chart: EUR/USD H4


Friday, October 14, 2016

Forex Trading Essentials | Online Course

The market has been very difficult to handle in the past few weeks. In an environment so heavily influenced by uncertainty it is mandatory for every trader to know their strategy, goals and risk management. 

Here comes the good news: ActivTrades is doing an online trading course called Forex Trading Essentials. It will be hosted by the experienced trader Martin Walker, the founder of Forex Trading London. You will not want to miss this opportunity to learn key techniques, strategies and overall education on Forex. Participants can also share their experiences with other members as well as ask their questions directly. 

The course starts on Oct 17 and is packed with valuable insights until its end on Oct 28. 

The only requirement is to deposit 100 units of your account base currency into your live trading account at ActivTrades.

For more information on the course visit HERE.


Thursday, October 13, 2016

USD/CAD And Market Uncertainty

USD/CAD has been very difficult to trade in the last few weeks. The pair has seen major ups and down day in and day out. This uncertainty indicates that market participants cannot come into agreement and this sentiment is driving the pair into highs and lows on a daily basis.

Currently, USD/CAD is gravitating towards 1.3287. So far today this is the third consecutive day of gains, but remains unclear just for how long it will continue in that direction. 

From a trading perspective our market has been very choppy over the past few weeks... There has been a lot of false breakouts. This is why it's important to risk a small amount of your trading capital on any one trade. If you can navigate through the choppy times in the market you will do just fine when the market is in more of a sustained direction. I still believe there is a positive bias to the overall market, but definitely has been on the choppy side lately.

Chart: USD/CAD D1


Wednesday, October 12, 2016

GBP/USD Slips To Lower Levels

GBP/USD is trading to the downside again after the surprise plunge on Friday pushed price to a low of 1.1919. After Friday's crash, the pair recovered to a high of 1.2482 and that was the highest point before it took South again. Yesterday, GBP/USD had another mild crisis losing as much as 240 points going from 1.2330 to 1.2089. The recent fall happened in the evening hours of the European session and was not strong enough to continue in the same direction so the bulls took hold of the situation and managed to recover the pair to a high of 1.2225.

However, this looks far from the end of the Sterling crisis. The news is that the UK government will initiate the Brexit as soon as March next year. This means that until then, the future of the single currency remains under pressure. Even after March there could be another crisis as the uncertain times would have just begun.

Chart: GBP/USD M30


Tuesday, October 11, 2016

EUR/USD In a Tight Range

EUR/USD has been very patient in following the long-term triangle pattern. The pair has been narrowing its range for more than a year. The consolidation move started in May 2014 when the price of the EUR/USD was 1.40, now more than 2 years and 300 points later the price is 1.11 with a low below 1.05.

Finally, the pair has reached the end of the narrowing triangle and is about to choose whether it will go South or North.

One thing is for sure, 1.12 remains in history as the make it or break it level. The pair has been gravitating towards 1.12 since it came to a halt after the big drop from 1.40.

Current market price is now 1.1133 and today we have the Euro-Zone ZEW Survey (Economic Sentiment) (OCT) which can bring some volatility in the market.

Chart: EUR/USD D1


Monday, October 10, 2016

USD/CAD Close To Resistance

USD/CAD is trading dangerously close to a mid-term resistance in the face of 1.3320. The pair reached a high of 1.3313 during Friday's closing hours and then gave in to bearish pressure making a low around 1.3185. USD/CAD is now trading at 1.3151, which appears to be safely below the potential breakout. However, main trend on the short-term remains bearish and with current December rate hike rumors on the table the US dollar might be destined to make new highs.

On the bearish side we have some advantages with price already below the 200SMA and about 200 points below resistance. These factors may further strengthen the bearish camp and plunge the price lower to a first support level at 1.3120.

Whatever the case, the rest of the year looks very very exciting with a possible rate hike, the US elections, a Brexit and cheap Gold.

Chart: USD/CAD D1


Friday, October 7, 2016

British Pound 6% Down in 60 Seconds

Remember the famous movie "Gone in 60 seconds"? Well, a lot of traders and investors woke up this morning in unbelief seeing that the British Pound lost 6% of its value in less than 60 seconds in between the US and Asian session.

The Sterling is down against all its peers and what's even more mind boggling is the cause of this effect. Seemingly, there was nothing to cause the sell off of this currency and according to some analysts, the nosedive is due to the "fat-finger" error. While this might be true, other argue that big players are eating up all the stops considering how many people anticipated the latest lows in the GBP pairs and waited to go long on them.

In numbers, GBP/USD is down from 1.2622 to 1.1919, currently trading at 1.2466.
GBP/JPY is down from 131.24 to 122.38, currently trading at 129.37.
Other GBP pairs are just as affected as high volatility continues to drive the currency markets to the extremes.

NFP and jobs data are scheduled for 8:30 Eastern today and that can only add more uncertainty in the already over saturated Friday market.


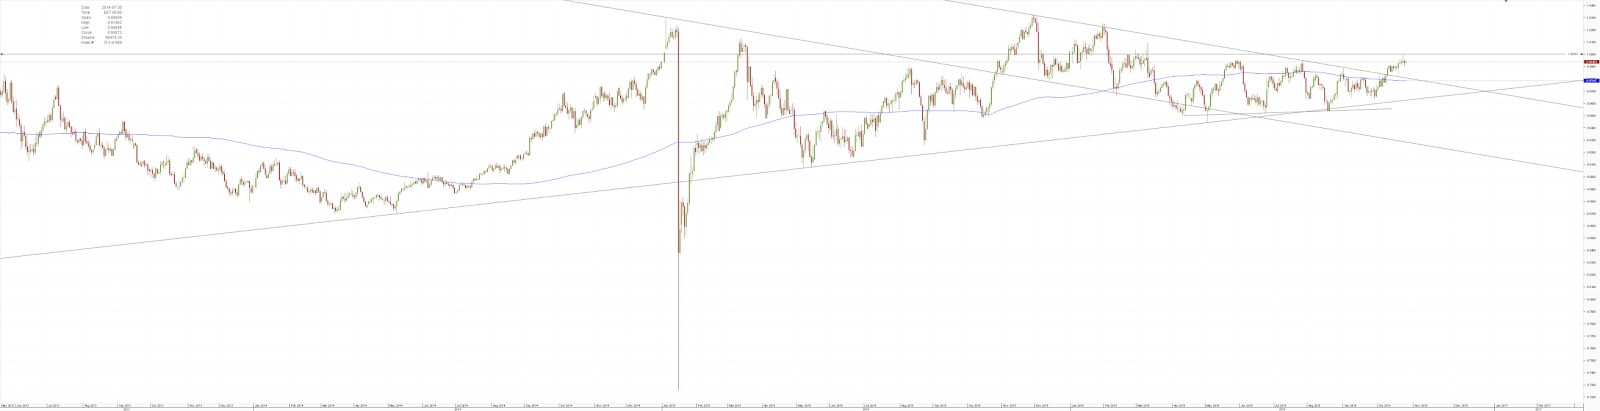
To describe the havoc, here is a GBP/USD 1min chart:


Thursday, October 6, 2016

AUD/CHF Continues To Depreciate

AUD/CHF is having another day of falling prices. The pair has been trading in the red for a third consecutive day now and has already lost some 100 pips these week. AUD/CHF reached a high of 0.7522 on Tuesday and has been on the down side since then making a low of 0.7395 today. The pair might be able to find minor support at 0.7380, but if bears keep the momentum, then they might very well bring the price down to a fist support zone at 0.73, after that second support is seen at 0.7240 and major support zone rests at 0.7090.

On the other hand, if bulls take control over the situation, we will have to go through the latest high of 0.7522 in order for a bullish trend to be confirmed. Until then we are stuck in the middle waiting for some news to create new volatility that could determine the next big move in the pair.

Chart: AUD/CHF H4


Wednesday, October 5, 2016

Gold Sell Off

Gold witnessed a massive sell off yesterday which was mostly due to technicals. The precious metal was trading in consolidation around $1,320 for several days before finally giving up on the thought of going higher.

Yesterday Gold reached a low of $1,268 and is currently trading at $1,271. The sell off was very sharp so post selling pressure might continue to drive price lower to a possible first target of $1,257.

If we reach $1,257 today it would be a very good moment to enter long with a stop at $1,248. If we continue to stay on the same level around $1,270 it would be best to wait for a confirmation to see how this scenario plays out.

It's an interesting chain of events currently happening in the markets as we have a historical low Sterling, a very strong US dollar, a weak Euro and a very strong Yen. All of this could indicate a potential crisis that would wipe out all overexposed portfolios.

Chart: XAU/USD H4


Tuesday, October 4, 2016

GBP/USD New Low

GBP/USD made a new low today even lower than the after effect of the Brexit sell off. Immediately after the results of the Brexit referendum were published, GBP/USD fell double-digit percent from 1.50 to 1.3227 and a few days later the bottom came at 1.2795.

Today, the pair has gone under that 30-year low and reached a low of 1.2740. All GBP pairs are affected by the depreciating of the UK currency and as a result those pairs are making historical highs or low depending on which side the Sterling is.

Current market price of GBP/USD is 1.2750 which is already below support and that can be interpreted as an early indicator of a progressive selling that will occur in the days to come.

Staying out of the market right now might prove to be the only solution for preserving your capital.

Chart: GBP/USD D1


Monday, October 3, 2016

EUR/USD Consolidating

EUR/USD has entered into consolidation on the first day of the week. The pair has been gravitating towards the 1.1230 level which appears to be a short-term resistance after price made a low of 1.1154 on Friday and then got a boost from the bull camp soaring to a high of 1.1250 in less than four hours.

Price is now 1.1233 as light volatility has settled in the market today. Light volatility is usually a sign of either a change in trend or an accumulation of force that will push price further in the same direction.

First support zone is expected at 1.1220, major support is seen at 1.1170. On the other hand, first resistance is seen at last high of 1.1250, while major resistance is seen at 1.1280.

Chart: EUR/USD H4