Wednesday, March 30, 2016

EUR/USD Uplifted

The EUR/USD is trading higher thanks to the FED statements made yesterday by Chair Janet Yellen. In a meeting in the Economic Club of New York she spoke about the strengths of the US economy, the risks and uncertainties in the current economical state. She made remarks that the key to raising rates is "gradualism". 

In turn, markets participants read those signals as bearish for the US dollar and the pair surged to 1.1250 while the meeting was still happening. Today the EUR/USD continued its uptrend and reached as high as 1.1309. 

The pair is now faced with its first challenge - going above 1.1330 as this is the immediate resistance. On the other hand, a correction might be expected that would take the pair back to 1.1160. 
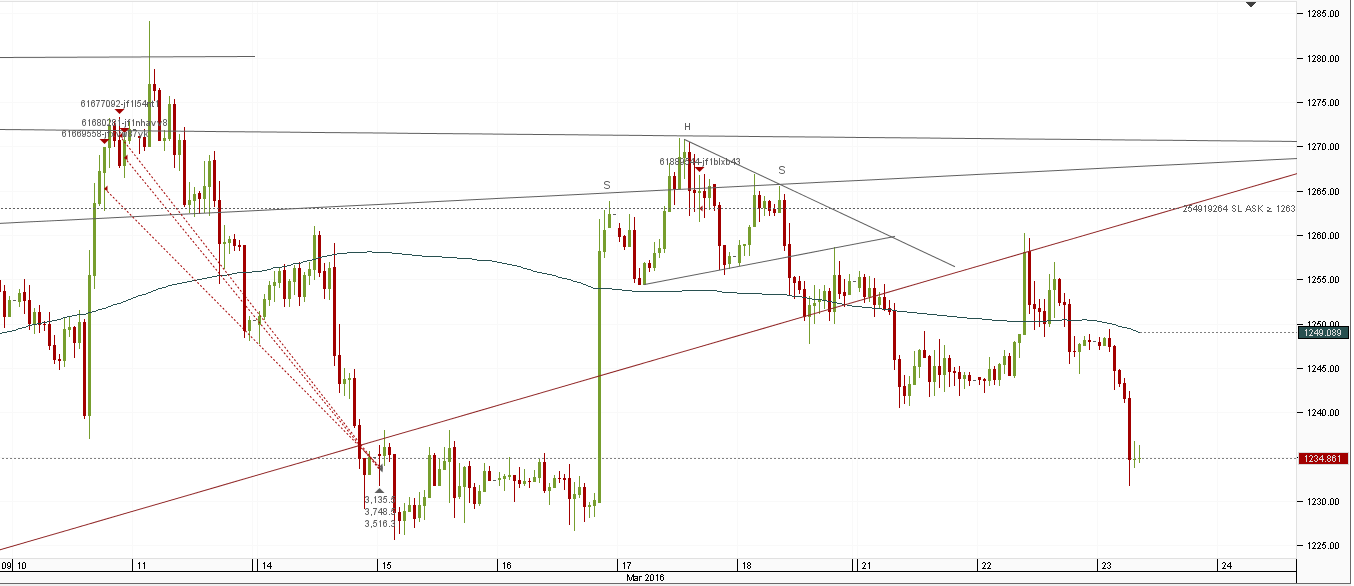
Chart: EUR/USD D1


Tuesday, March 29, 2016

Markets Await Yellen's Speech

The financial markets are currently in a stressful situation as we are about to witness the most important event for the month - US Fed Chair Janet Yellen Speaks To Economic Club of New York. Chair Yellen has a lot to talk about as traders and investors worry over the dovish tone used in previous press conferences.

If she decides to follow script, we will hear that a rate hike is probable next month. A hawkish tone is what would make the dollar surge and Gold succumb to $1,200. The relatively stronger US growth is indicative that a rate hike remains on the deck. Speech is in less than a couple of hours so if you would like to save yourself the tension and volatility caused by the event it would be best to get out of the market until waters are calm again.


Monday, March 28, 2016

Gold At $1,208

Gold reached it's lowest point since mid-February at $1,208. The opening hours were favored by the bears who were happy to see Gold almost reaching the psychological level of $1,200. After the decline, however, price managed to recover and reached $1,218.80, more than $10 in just a few hours.

The decline is also influenced by the H&S pattern seen on H1.

Due to the high volatility it is advisable that traders and investors refrain from taking heavy positions on high leverage. Major target in current short-term bear trend is $1,195, while first resistance is $1,219.80.

Chart: XAU/USD H1


EUR/USD At Support

The EUR/USD is trading at support at current level of 1.1170. The pair failed to reach resistance at 1.1410 and turned south at 1.1341. Since 1.1341, the EUR/USD has been declining until today when bulls decided it was time to get back in action.

Although it is too early to say that a reversal is happening, if this level hold then we might see price reach 1.1450. Before that, we have first resistance level at 1.1230. If current level is broken then bears might trigger further decline to next support level of 1.1040 (200SMA) and then 1.0800-1.0780.

Chart: EUR/USD D1


Friday, March 25, 2016

EUR/USD In Consolidation

Since mid-week the EUR/USD has been under-performing bound within the range of 1.1188 - 1.1150. The lack of fresh news to stir the market is obvious and traders and investors are not interested in investing in something that would not do anything. So they shift their attention to more volatile pairs and commodities that beat the EUR/USD in volatility. 

No major news are expected today so we might witness a calm and non-eventful time for the EUR/USD. Short-term trend is bullish with price currently in the support zone at 1.1140. Below 1.1140 bears will try to take control and further depreciate price to 1.1080.

Chart: EUR/USD H1


Wednesday, March 23, 2016

GBP/USD Losing Grip

The Sterling is sharply depreciating against its main competitor - the Dollar. The pair lost close to 400 pips in less than a week going from 1.4512 to 1.4160. Currently, GBP/USD is trading around 1.4170.

First support rests at 1.41, second support is 1.4050, third support level is seen at 1.40. Below 1.40 bears will try to push prices to multi-year low of 1.35. On the other hand, first resistance is seen at 1.42, second resistance level is seen at 1.4240 and third support level is 1.43.

Main trend remains bearish as price again entered into the downward channel seen best on daily chart.

Chart: GBP/USD H4


Gold Drops To $1,231

The precious metal lost some $30 since yesterday's climb as traders and investors made a flight to safety and boosted prices to $1,260.33 in response to the horrible events that took place at Brussels airport and metro yesterday.

In the early trading hours, Gold depreciated and went down to $1,231 to currently trade at $1,235. Gold broke the support line at $1,245 which makes it a desirable prey for bears. If Gold continues to trade below support, we may see an attempt to take over the $1,200 level.

Gold has been in an uptrend since it's lowest at $1,046 made in mid-December which suggests that we may see a correction to the opposite side.

Chart: XAU/USD H1


Tuesday, March 22, 2016

Brussels Blasts Impact The Markets

This morning the people of Bruxelles woke up to deadly scenes all over the news. Two explosions occurred at Brussels airport and reports of blast in metro. 17 people have been reported killed and dozens are injured. Airports are in lock down, main stations and metro system are also shut down until 6AM tomorrow morning due to a suicide bomb attack and a follow-up blast at the airport and the metro.

The situation impacted the markets immediately. Gold is up $16 to $1,260 from $1,244, the euro is down against the dollar to 1.1188 from 1.1258. All European currencies suffered a decline. Because of the uncertainty caused by the attacks in Brussels, staying out of the markets would be the safest thing you can do today.

My prayers are with the people of Brussels. Stay strong!


USD/CAD Recovery?

The USD/CAD is trading higher in the last few days to the large part due to technicals and oversold levels. The pair reached as low as 1.2920 breaking the short-term downward channel and the long-term upward channel.

Currently, price is trading at 1.31, which is a success for bulls as they managed to bring price back into the short-term channel where it can find the support it needs in order to push higher the next time it gets there.

For now, support remains at the level of 1.30, while resistance is the level of 1.3110.

Chart: USD/CAD H4


Monday, March 21, 2016

Gold H&S Pattern Just Like Those In The Textbooks

Gold drew a beautiful pattern just like the ones that we read about in the technical analysis books. As seen on the H1 chart below, the precious metal made the left shoulder, went down to form the neck and proceeded with the head and the other shoulder going to neckline each time.

After it broke the support on the H&S, price declined to the long term support at $1,250 and then reached one more time to what is not H&S resistance, could not pierce it and depreciated again this time going below the 200SMA on H1 and the long term support at $1,250.

Currently Gold is trading at $1,245, going as low as $1,240. On one hand, Gold bears may try to break the previous low of $1,225, on the other hand, Gold bulls may attempt to close above $1,255 thus bringing Gold back into the short-term upward channel.

Chart: XAU/USD H1


Friday, March 18, 2016

How to Overcome Fear in Trading | Webinar

Fear is considered one of the main problems that traders need to deal with. In this week's webinar, ActivTrades' Paul Wallace presented techniques and approaches to tackle this top enemy of all traders.

In order to overcome fear in your trading you have to be able to recognize it and treat it as a problem. Changing your frame of mind and your expectations can lead to good results regarding psychology in trading.

If you want to stay informed about future free webinars, just click here.


Thursday, March 17, 2016

Gold Up

Gold is shining again as traders and investors are worried about the US economy and the dovish tone by the FED. As we heard yesterday, Janet Yellen does not plan on raising rates this month which was enough to act as a catalyst for Gold's prices to skyrocket.

Gold rose from $1,225 to a high of $1,270 and is currently trading close to it's high around $1,265. Regardless of the quick gains, Gold remains into bear territory and further depreciation is more likely than a continued buying that would drive prices higher.

First support is seen at $1,252, while first resistance lays at $1,272.

Chart: XAU/USD H1


Wednesday, March 16, 2016

GBP/USD Sharply Down

Fortunately for Sterling bears, the pair is now trading more than 400 pips lower compared to the week before. Current price is 1.4060, but seeing the sharp downtrend on the daily, it might as well try to test the levels around 1.36.

Be aware that all time low of 1.3447 might also come into consideration as a possible target for bears in the long-term.

On the other hand, bulls are trying to stop the pair from going lower than 1.4070 and if they are successful then we will see a reverse head and shoulders formation on the daily. This means that we are currently at support and we should see price bounce off current levels.

Chart: GBP/USD D1


Gold Consolidating

Gold entered into consolidation since yesterday morning when it was trading at 1,233. Until now the precious metal has not made any significant moves and is trading around the $1,230 level.

Main trend for the long-term remains bearish with strong resistance at $1,285, strong support at $1,133.

On the other hand, short-term Gold looks bullish with first support level at $1,220, first resistance level at $1,240. $1,294 is the possible target for bulls and having in mind current economic state of both the EU and the US, Gold bugs might make a flight to safety and turn to Gold as an all-time safe haven once again.

Chart: XAU/USD H4


Monday, March 14, 2016

Gold Down

Gold lost some $20 on Friday when everyone was hyped about the $1,300 level. This happened when Gold reached $1,284 Friday morning and kept losing gains throughout the whole day when it finally dipped below $1,250 reaching $1,248.

In today's session Gold made a slight correction going to $1,261 and is currently trading at $1,253-$1,255.

In the short-term, i.e. next two weeks, main trend continues to remain bearish with first target $1,242, second target $1,230.

In the long-term, i.e. next two months, main trend is bullish with first target $1,285, second target $1,300.

Chart: XAU/USD H4


Wednesday, March 9, 2016

EUR/USD Slightly Down

The EUR/USD is trading lower due to major technical factors currently preventing price from going beyond 1.1045. The pair is trading at 1.0980, going as low as 1.0967 in the early trading hours today.

Although the Euro saw a few positive days last week, the 200SMA is making sure Euro bulls do not get overexcited and managed to stop price twice from going above 1.1050.

Important Euro are scheduled for tomorrow:
- European Central Bank Rate Decision 12:45GMT
- ECB Deposit Facility Rate 12:45GMT
- ECB Marginal Lending Facility 12:45GMT
- ECB Press Conference 13:30GMT


Tuesday, March 8, 2016

EUR/USD Bearish Pressure

The EUR/USD got as high as 1.1057 in today's trading but due to heavy pressure caused by the bears, the pair could't keep up with the gains and reacted to the 200SMA losing as much as 56 pips making a low of 1.1001.

Good news for the Euro bulls is that the pair reached major resistance for a second time in only three days but this time it pierced the 1.1045 level, indicating that the Euro might be getting ready for a bull run.

Currently, the pair is trading at 1.1015 but we still have important data scheduled throughout the week which will impact the price, keep an eye on 1.1045.

Chart: EUR/USD D1


USD/CAD Reached The Shore

USD/CAD is trading right on the 200SMA, thus marking a strong support at 1.3300. Currently, price is 1.3380, after a sharp rebound from the low of 1.3261. Although, the steady decline has been going on for almost two months, the pair seems to be getting ready to make a turn.

In case a market turn happens, then price might attempt to test the level of 1.3475, which is the first short-term resistance. Second resistance appears the level of 1.3550.

On the other hand, a continuation of the downward movement would lead USD/CAD to major support zone at 1.3170-1.3200.  If this level is breached, then the pair would get out of the long-term bullish channel and would end up targeted by aggressive bears ready to tear it up.

Chart: USD/CAD D1


Monday, March 7, 2016

Silver Uplifted

Silver is trading higher today due to technicals as main factor for a bull run. After a few days of consolidation on the upper trendline and the 200SMA, Silver bulls reacted strongly seeing an opportunity to buy low at around 14.85.

Price is currently 15.66 with a high of 15.785 for the day. Today is the fourth consecutive day for Silver gains, implying that a correction or a consolidation might be just around the corner.

First level of resistance is 15.93, second level is 16.37.
First support is seen at 15.30, second support is 14.95.

Chart: XAG/USD D1


Gold Slightly Above Resistance

Gold is trading relatively higher in today's session gravitating around the $1,270 level. The resistance of $1,260 was taken out and the only thing left now is for Gold to close above $1,270 so that we would have a reason to believe the precious metal is ready to take off.

Next resistance is $1,280, and if this level is broken then we might witness Gold make an attempt to reach the psychological level of $1,300 for the first time since January last year.

Whether or not Gold continues to climb up, it's price remains low making Gold one of the best commodities to buy and hold for the long-term.

Chart: XAU/USD H4


Friday, March 4, 2016

Live Trading Analysis (Webinar review)

ActivTrades just had one of its webinars, but this time slightly different. The guest speaker, Will Hunting, presented an hour-long webinar special of live trading analysis.

This was a great opportunity to learn live how to use the MetaTrader 4 platform, how to make your decisions based on technical analysis using significant key levels, and how to catch market turns by reading charts correctly.

For all those who missed, worry not, you can see future free webinars HERE.


Tuesday, March 1, 2016

GBP/USD Indecisive

The Sterling keeps depreciating against its major competitor - the US Dollar. Currently, the GBP/USD is trading at 1.3937 and has not yet decided where it wants to go. On one hand, we have the rumors that a possible Brexit would further depreciate the Sterling and although only a rumor, traders and investors are bearish about the future of GBP.

On the other hand, the pair is trading at 9-year old bottom and a correction is waiting to take place as soon as possible.

The faith of GBP/USD is still not clear. First support is seen at the lowest low of 1.3334, while first resistance is the level of 1.4052.

Chart: GBP/USD H4


Silver At 200SMA

Silver is trading at the level around the 200SMA, which makes it one of the most anticipated commodities right now. What's even more interesting is that current price is testing the upper trendline, which acts as major resistance.

A move above the 200SMA would also be a move above resistance, which is a strong indicator that Silver is ready for take off.

A move below the 200SMA would also invalidate the attempt to break through resistance and further depreciating might be expected.

Currently, Silver is trading at $15. Every cent up or down is significant, so pay attention to price behavior this week to get an idea where it's going to go.

Chart: XAG/USD D1