Michael Marcus is considered to be one of the first people who employed technical trading to their investment strategy. He is famous to have amassed a substantial amount of money relying on his support and resistance levels and trading at a ratio of about 1 to 15, 1 to 30. This means that even if he had 29 losing trades, the 30th would even his account.
Here are some his most noted quotes:
1) Being a successful trader also takes courage: the courage to try, the courage to fail, the courage to succeed, and the courage to keep on going when the going gets tough.
2) Perhaps the most important rule is to hold on to your winners and cut your losers. Both are equally important. If you don’t stay with your winners, you are not going to be able to pay for the losers.
3) I think the leading cause of financial disablement is the belief that you can rely on the experts to help you. Investing requires an intense personal involvement.
4) Every trader has strengths and weakness. Some are good holders of winners, but may hold their losers a little too long. Others may cut their winners a little short, but are quick to take their losses. As long as you stick to your own style, you get the good and bad in your own approach.
5) Mathematics is the supreme nostalgia of our time.

Saturday, December 30, 2017
Paul Tudor Jones Quotes
Paul Tudor Jones is considered one of the most successful traders. He is still on the stage running his fund and although he is not generating as big of a return as he used to in his prime, his wisdom remains one of the most profound and essential in the market.
Here are some of his memorable and valuable quotes on trading and investing:
1) The secret to being successful from a trading perspective is to have an indefatigable and an undying and unquenchable thirst for information and knowledge.
2) Macro-trading requires a high degree of skill, focus and repetition. Life events, such as birth, divorce, death of a loved one and other emotional highs and lows are obstacles to success in this specific field of finance.
3) I believe that great success is possible in any field - from music to mathematics to macro trading.
4) At the end of the day, the most important thing is how good are you at risk control.
5) Don’t be a hero. Don’t have an ego. Always question yourself and your ability. Don’t ever feel that you are very good. The second you do, you are dead.
6) Markets trend only about 15 percent of the time; the rest of the time they move sideways.
USD/JPY Depreciates
USD/JPY has been trading to the downside for the past week as the pair posted minor losses going from 113.60 to 112.45. The pair appears to still be going into the downside as the medium term sentiment remains bearish.
As the last trading day of the year closed yesterday, price would open at 112.65 to start the new year. Short-term sentiment is bullish with first bull target at level gravitating towards the double top at 113.60. If that level is taken out, USD bulls will try and push price to 114.70.
Above that the medium term trend would be changed from bearish to bullish. However, if the current sentiment continues to drive the price South, we should see the bear push the price towards major short-term goal at 110.80.
Chart: USD/JPY H4

Thursday, December 28, 2017
Gold Approaching Resistance
After the significant EUR/USD move to the upside, Gold was the asset that also gained in value in face of a depreciating US dollar. The precious metal is now trading at $1,294, up from $1,236 just two weeks ago.
The increased interest in the safe haven is due to the uncertain economic condition in the US and the latest interest rate. Gold is now faced with the opposition at the psychological level of $1,300 where a lot of Gold bears would jump in attempt to bring the price down. First bear target is seen at $1,275, second - $1,250 and third - $1,235.
If bulls are able to break through resistance we might see Gold shining again with new strength. Major bull target is expected at $1,300 which would then act as major support level.
Chart: XAU/USD H4

EUR/USD Close To Double Top
The EUR/USD pair is now trading close to double top. The Euro made a strong comeback this year as it went as low as 1.05 and slowly but surely made its way to highs around 1.20. The pair is currently trading at 1.1950 and it appears that it's ready to move further up.
If it reaches 1.1965 this would create a double top and potentially there is a chance that the trend would turn around. However, if the trend persists to the upside due to increased buying momentum, we are to see a break above the double top resistance and a continuation of the upward move.
First bull target is seen at 1.1965, if this is taken over, second bull target is the level at 1.2050 and third bull target is seen at 1.2150. On the other hand, weak buying pressure could expose the pair to uncertain times. First bear target is seen at 1.1730, second bear target is seen at 1.1640 and third bear target rests at 1.1550.
Chart: EUR/USD H4

Friday, December 22, 2017
ActivTrader Platform
Many traders from all levels experience difficulty trying to find a suitable platform that can match their expectations. Traders should spend a good amount of time researching into platforms so they could make a rational choice which one to pick and why.
This is why ActivTrades has taken care of all traders' needs by providing all-in-one solution with their ActivTrader Platform. It is available for desktop and mobile. East to use platform with wide range of instruments accompanied by advanced charting and many tools to boost your trading experience.
You can open a new account or try a demo for free so you could familiarize yourself with any detail and research into the opportunities the platform present. For all interested, click HERE.

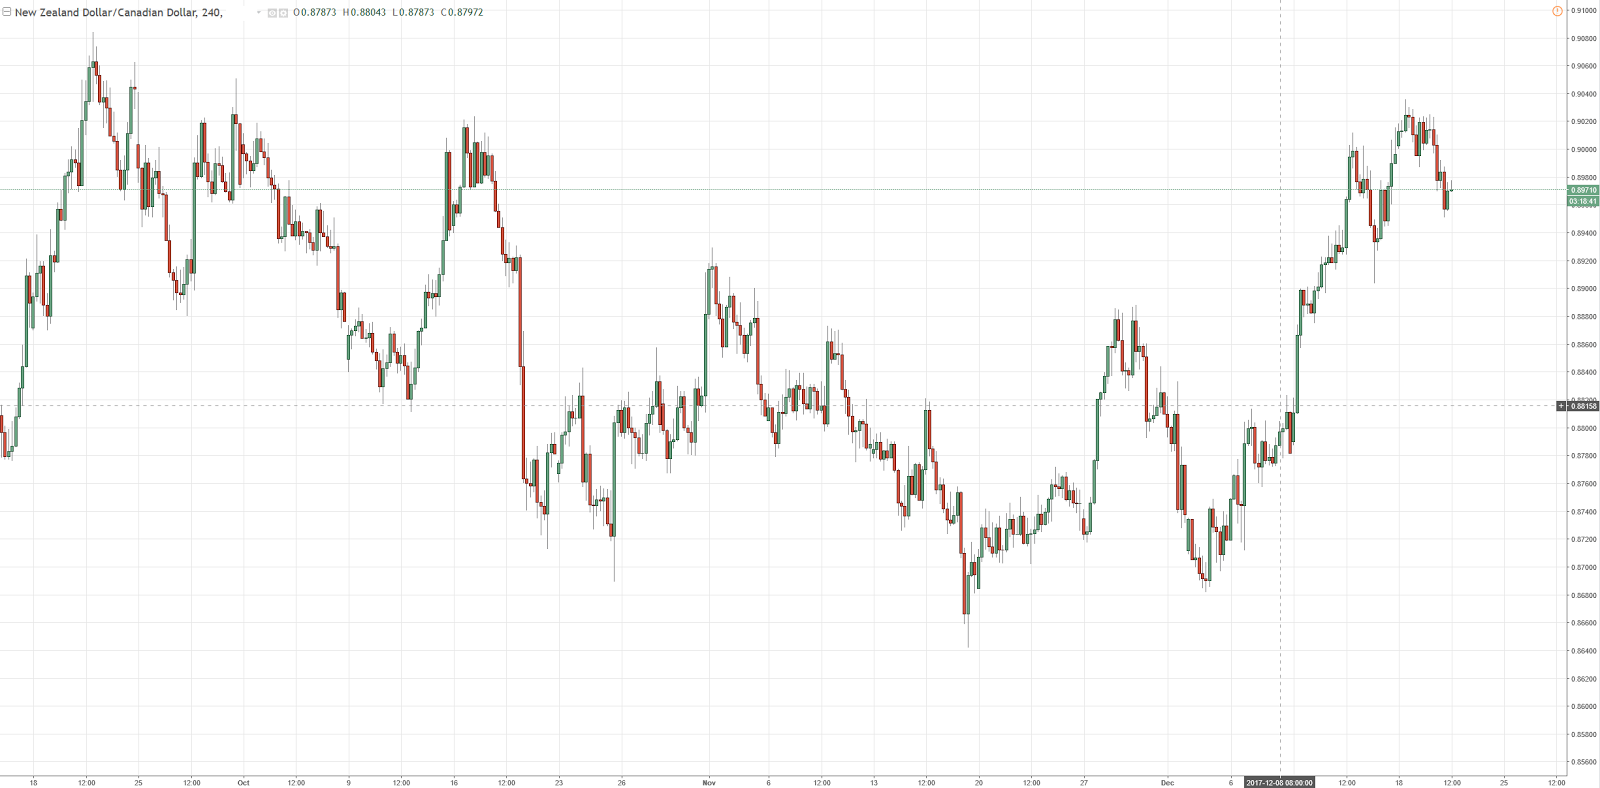
NZD/CAD Posts New Losses
NZD/CAD is down to 0.8901 in today's trading session after the Canadian dollar posts some gains on relatively bearish news regarding the Canadian economy. Core PMI data released yesterday showed -0.1% missing expectations at 0.3%. However, Core Retail Sales turned out to be double than expected at 0.8%.
The Canadian dollar posted gains against all competitors yesterday and transferred the rally to today. However, in the last few hours CAD has been looking relatively weak and losing some grounds against its peers.
Currently, NZD/CAD is standing at 0.8925, slightly higher than its lowest point earlier today. If the pair continues on the downfall, we could be looking at 0.87 as a major support for short term horizon and 0.8640 as a major support on the medium term horizon.
Chart: NZD/CAD H4

Thursday, December 21, 2017
Gold Higher
Gold has been trading to the upside for the last couple of weeks. Price reached a low of $1,236 on 12th Dec and has been on the upside since then reaching a high of $1,268. Current market price is $1,263, slightly lower than the highest high but still showing signs of strength.
As the US dollar is depreciating, market participants flock to safety into the precious metal. Bulls' first target is seen at $1,275 which would break the support turned resistance and would suggest that Gold is ready to push higher to the psychological $1,300 level.
On the other hand, gold bears could try and bring the price to a double bottom level at $1,235 and possibly even lower if the US dollar stabilizes.
The remainder of the year is expected to present a calm trading environment as market participants will most likely trade lighter volumes in exchange to more time spent with family and loved ones during Christmas time.
Chart: XAU/USD H4

USD/CHF Consolidated
The USD/CHF pair is trading in consolidation for the past couple of week. The price has experienced somewhat of a congestion in the range of 0.9900 and 0.9820. Main trend on the short term scale is neutral as the pair is trading sideways.
Market participants would need a market shaker that could stimulate both sides to take action and this would break the range trading. Bulls are now trying to outrun as price has made some attempts in the last few hours to post fresh gains going from 0.9832 to current market price of 0.9887.
If bulls could go above 0.99 this could further ignite buying power and push the price higher to parity. On the other hand, bears are dominating the mid-term horizon as price is now out of the upwards trending channel and currently looking to form a new one.
Chart: USD/CHF H4

Wednesday, December 20, 2017
NZD/CAD Correction
The NZD/CAD pair has been moving steadily to the upside for the past couple of weeks going from 0.8680 to a high above 0.90. Currently, price is a bit lower trading at 0.89710. If the correction is sustainable this could take the pair to first level of support at 0.8900.
Second support level is seen at 0.8808. The latest top almost made a double bottom before retracing in the opposite direction as bears were eager to short the pair. Major bear target is now seen at 0.8700.
On the other hand, if bulls can take the pair to a new high we could be looking at a continuation of the bullish movement that started at 0.8680. First bull target would be to take out the resistance in the face of 0.9030, second target would be a break of 0.91.
Chart:NZD/CAD H4
Friday, December 15, 2017
Jesse Livermore Quotes
Jesse Livermore, also known as the Boy Plunger, is famous as being one of the most successful traders and speculators. He netter a profit of 100 million in the 1929 stock market crash. His discoveries about the market are still regarded as one of the best.
Here are some of his best lines on trading, speculation and investing:
1. “After spending many years in Wall Street and after making and losing millions of dollars I want to tell you this: It never was my thinking that made the big money for me. It always was my sitting. Got that? My sitting tight!”
2. “Experience has proved to me that real money made in speculating has been in commitments in a stock or commodity showing a profit right from the start.”
3. “It is literally true that millions come easier to a trader after he knows how to trade, than hundreds did in the days of his ignorance.”
4. “The market does not beat them. They beat themselves, because though they have brains they cannot sit tight.”
5. “I never hesitate to tell a man that I am bullish or bearish. But I do not tell people to buy or sell any particular stock. In a bear market all stocks go down and in a bull market they go up.”
Thursday, December 14, 2017
Gold Up on Weak Dollar
Gold is trading sharply to the upside since yesterday's announcement by the Fed to raise the interest rate. The precious metal reacted bullishly to the news as traders and investor flew to it as a safen haven in light of the depreciating US dollar.
Lately, Gold has been losing ground making new bottoms and exiting trading channels thus making it hard for investors to find a good long entry point. The latest depreciation in Gold could still not be over. Yesterday's price boost sent Gold to $1,259 from a low of $1,235.
The upward move in Gold does not appear to be sustainable and the trend may soon continue on its way down. It's important to have clearly defined entry and exit points before entering into the Gold market in such an uncertain trading environment.
Chart: XAU/USD H4

EUR/USD Up Despite Rate Raise
The FED raised the interest rate from 1.25% to 1.50% yesterday during the press conference. Oddly, however, the market reaction was to sell the US dollar, which could be counter as a classic buy the rumor sell the news scenario.
EUR/USD went up quite sharply after the announcement as the initial reaction was a move from 1.1760 to a high of 1.1845. The pair is still trading to the upside, although somehow lower with current market price at 1.1825.
Main trend on the short term remains neutral with sideways trading between 1.19 and 1.17. Major medium term resistance is seen at the 1.1950 level and medium term support is seen at the 1.15 level.
Today we have the ECB interest rate decision expected to remain unchanged and later we are to hear Mario Draghi speak on current economic conditions and future outlook for the EU.
Chart: EUR/USD H4

Wednesday, December 13, 2017
USD/CAD Consolidates
USD/CAD has consolidated around the level 1.2860. The pair has been trading to the upside lately as the USD made some gains against major competitors, EUR included. USD/CAD however has gotten into congestion point just a few points below the short-term resistance.
As short-term resistance stands at 1.2910, USD bears might prepare another run towards their goal and if successful, they might even go for medium term resistance at 1.3160.
On the other hand, bears could try and bring the price down which would be highly unlikely to happen before the FED release.
FED is preparing to release their latest decision on Interest Rates and the market is already expecting .25% raise from 1.25% to 1.50%. They have mentioned multiple times that they do not want this to be a surprise for the market but still heavy volatility is to be expected today evening 19:30 GMT.
Chart: USD/CAD H4

EUR/NZD Touches Support
EUR/NZD has been trading to the downside for the past couple of weeks. The pair reached a low of 1.6890 from a high of 1.7480. Main trend on the short-term remains bearish until we can get a strong support reaction from market participants at current market price.
The trend has halted for now until we see if the support would be strong enough and turn the trend to the upside. So far the bulls are managing to withstand the blows of the bears and the price has fluctuated between 1.6940 and 1.6890.
If we get below 1.6890 and see a close then this would be a strong indicator that price has breached support and is ready to continue to the downside. For the moment, however, it is best to wait it out and see what price does before taking any positions.
Chart: EUR/NZD H4

Friday, December 8, 2017
SmartPattern by ActivTrades
A powerful indicator called SmartPattern is designed by ActivTrades to help you in your trading game. The pattern is made for history buffs that believe that history repeats itself. Myself being one of those, I strongly recommend that you look into this.
As history truly does repeat itself, it is no wonder then that the market is just another field in which we can observe the recurrent processes and event that have already happened and will happen again.
SmartPattern can help you analyze any market in any time frame and what it does is it detects chart patterns and detailed statistics.
Based on technical analysis, the SmartPattern tool can save time, effort and eliminate bias in your trading judgement.
It's available for ActivTrades Live clients and is completely free for unlimited time. For more info, visit HERE.

Tuesday, December 5, 2017
Silver Steady Ahead of NFP's
Silver is trading at its lowest point since the month of August when the precious metal reached a low of 16.11. Currently, Silver stand at 16.27, a level of consolidation for the past few days. If the metal continues to gravitate freely into the chart, we might see a continuation of the depreciation to first support level at 16.11, the level that would mark a double bottom. This would be a good chance to enter long in the market with a tight stop slightly below 16.11.
If we have reached that level before Friday's data release we could see a bullish move in the precious metal market, both silver and gold.
On the other hand, a better than expected US data would drive gold and silver to levels below long support which would indicate that they are getting deeper into bearish teritorry.
Silver has been trading sideways for the past 7 months, we could expect it to break away from the pattern and start on a new journey.

GBP/JPY Depreciates After Failed Negotiations
The Sterling depreciated yesterday due to failure to come up with an agreement on the Brexit question. UK's PM Theresa May and Jean-Claude Juncker failed to reach a consenus on the Brexit terms and what initially seemed like an event with a positive outcome ended up as nothing more than just a regular talk with no real consequences.
What was expected from yesterday's lunch was to pave the way from a divorce to trade between the UK and the EU but none of that happened and the Sterling took a dive depreciating against its peers.
GBP/JPY went as high as 152.949 and depreciated to 150.51 just a while ago. Currently, the pair is trading at 150.70, slightly higher than the lowest low but the selling wave is still taking place and we might see below 150 before the end of the week.
Chart: GBP/JPY H4

Monday, December 4, 2017
What to Expect into the Week
The week ahead has some interesting gems for the Fed watchers and overall market enthusiasts. Today, however, pretty much nothing has been scheduled. One thing that moved the market today was a lunch between the UK Prime Minister Theresa May. The discussion created a buying wave in the Sterling.
On Tuesday we have Australian Interest Rate Decision aimed to remain at current rate of 1.50%. Also Non-Manufacturing PMI will be released from the US and Services PMI from the UK.
On Wednesday Canada is announcing its Interest Rate Decision expected to remain unchanged at 1.00%.
Thursday the spotlight will be on ECB President Draghi to deliver a speech on EU political and economical stability and future outlook.
And Friday of course is reserved for the most important monthly US report - NFP's and Jobs report.

Sterling Up on Monday Afternoon
The Sterling is trading higher today after UK Prime Minister Theresa May and European Comission President Jean-Claude Juncker met for a critical lunch at 1.15pm. The purpose of the lunch is to make progress towards a deal between the U.K. and Brussels on Brexit.
A few other important political figures will accompany the duo at the lunch and together they will be discussing the steps towards fulfilling the agreement contract for Brexit.
The Sterling shot up against all parties as GBP/USD is now trading at 1.3513, up from 1.3418. GBP/JPY is at 152.71, GBP/CAD makes a trend turn with a high of 1.7160.
Some of the conclusions we can make are that Britain and EU have agreed to regulatory alignment but negotiations will continue until breakthrough.
Friday, December 1, 2017
Silver Breaks Support
Silver broke the medium term support yesterday as the precious metal fell below 16.50. That level was eyed by investors as a potential rebounce point and Silver did what it could to try and rebounce. The metal gravitated towards that level for more than a day when finally the sellers outweighed the buyers and price dipped to a low of 16.30.
Price has not changed much since the bottom was hit and now Silver is faced with new horizons below support. It may decide to consolidate until US announces the NFP's and Jobs report next Friday.
Whatever the case may be, it's important to know that market analysts are now more and more talking about a potential spike in the price of both Gold and Silver so you might want to consider the idea of having some of your capital invested in the precious metal market.
Chart: XAG/USD D1

Thursday, November 30, 2017
Ray Dalio Quotes
Today we'll look at the some of the most prominent quotes by Ray Dalio. He is the founder and chairman of the biggest hedge fund, Bridgewater Associates, currently managing over 160 billion dollars.
He started out as a stock trader and later developed skills to master markets on the global scale. Ray Dalio is revered as the man who figured all a strategy for all seasons, i.e. one that works at all times thanks to diversification and risk exposure.
Here are some of his best quotes on trading and investing:
1. “If you’re not failing, you’re not pushing your limits, and if you’re not pushing your limits, you’re not maximizing your potential”.
2. “Principles are fundamental truths that serve as the foundations for behavior that gets you what you want out of life. They can be applied again and again in similar situations to help you achieve your goals.”
3. “In trading you have to be defensive and aggressive at the same time. If you are not aggressive, you are not going to make money, and if you are not defensive, you are not going to keep money.”
4. “To me it all looked like a beautiful machine with logical cause-effect relationships. By understanding these relationships, I could come up with decision rules (or principles) I could model.”
5. “I believe that the key to success lies in knowing how to both strive for a lot and fail well.”
The Patterns of the Charts Part II
Human beings are indisputably all part of nature, so is their consciousness. What they create on the price-time charts is arguably "microcosm” of “macrocosm” in the universe. So their emotions and consciousness is in line with the “natural law” or the “universal order”.
A person by the name of W.D. Gann who was a stock and commodities trader and lived before the year 1955, tried to reveal the hidden structure of the markets both in price and time. Actually to him time was more important than price and he tried to link it all to “The Law of Vibration”. Most of you have probably heard his name and familiar with his methods.
The fact that matters is that there was a lot of secrecy in his work and he always kept things mysterious. Actually, he died with only $50,000 to his name but he had already made nearly $50,000,000 in his trading career. It is said that he deviated from his main analysis, trying to depend on “financial astrology” which was the cause of his failure. However, most of his courses have been modified and you may barely find his original courses out there, and on top of that there is ton of secrecy in his work.
Wednesday, November 29, 2017
GBP/USD Up on Agreement
The Sterling was trading to the downside yesterday and the day before going from a high of 1.3380 to a low of 1.3223. The downtrend was going smoothly as the pair was reaching new lows when all of a sudden the news broke out that the UK has reached an agreement with Europe regarding the Brexit.
The Telegraph has issued the news not stating any reasioning or details behind the deal but the market was quick to react and bought heavily into the UK currency.
That drove the price of GBP/USD to this morning's high of 1.3429. If the news turn out to be long term positive for the Sterling, then we might see a break above the long term resistance at 1.3450. Otherwise, if this ends up as unimportant, the market will disregard it and the Sterling will again be on its way down.
Chart: GBP/USD H4

The Patterns of the Charts Part I
Looking at markets and charts through a different perspective, other than just two sides buying and selling, we see things differently. Metaphysically, the patterns on the charts of the financial markets are all perfectly ordered by the Natural law of the Universe. You might just doubt it now and think that the moves on the charts are all random and everything, but you will see that these complicated zig zag patterns repeat themselves over and over as the time goes by.
It is the same case in all time frames. Some of you out there may suppose that this is the economic state that moves the charts, creating such complex zig-zag patterns but this is actually the human emotions doing so. When humans feel joy and prosperity we buy, raising the price index but when we start to feel fear and panic then we sell, lowering the price index.
The fact that matters is that this is the structure of human’s behavior graphed out on the charts, just as spider which is not aware of the beautiful web it builds. Therefore what traders construct in time and price charts are absolutely phenomenal and they should be able to study and research the humans behavior and consciousness instead of focusing on the markets and economic state.
Friday, November 24, 2017
Free Trading Archives
Resourcefulness is much more important than mindlessly browsing through the Internet for the right education that makes a trader. That's why it's important to narrow down on your information basis and pick only the the database that can deliver you useful and valuable knowledge.
Such database can be found on ActivTrades' Webinar Archive Section where you can find some of the most important lessons in trading. You'll find there important milestones in the latest market developments such as Brexit and other fundamentals as well as technical trading and lessons from trading greats such as Jesse Livermore.
It's especially vital for your trading success to pick the right source of information. If you want to dig deeper into their archive, feel free to visit HERE.

Tuesday, November 21, 2017
Gold Sell Off
Gold got sold off in yesterday's trading session due to fundamentally unknown reasons. The only probable reason is that from technical perspective Gold reached and breached the resistance level on the short term horizon at $1,295.
The precious metal went as high as $1,296.85 in the opening hours yesterday and bears took hold of the situation depressing the price to a low of $1,274 in the afternoon hours of the European session and just right before the opening of the US session.
Currently, Gold is trading at $1,280, a few points higher than latest low. Direction, however, remains unclear as price has been fluctuating in the range of $1,290 and $1,270 for the past few weeks.
If we can get a break above $1,290 and sustain price momentum we could expect Gold to close the year above $1,300.
Chart: XAU/USD H4

Silver Drafting a Cypher
A bearish cypher is on the rise for Silver. The precious metal went from 18.20 in early September to a low of 16.55 in early October. By mid-October Silver made a short lived rally that pushed the price to a high of 17.46. Then it went into consolidation and has not yet breached out of it.
The price is now 17.18 and as it appears, it's slowly moving out of the range towards the break of resistance at 17.40.
Silver is currently drawing a cypher pattern that would turn bearish at the end of it if all goes according to the rules. In such case, the metal would have to climb to $18.00 before November is over. If that does not occur, then the pattern would be deemed invalid.
Chart: XAGUSD H4

Monday, November 20, 2017
GBP/AUD Close to Resistance
GBP/AUD has been trading higher this month as price went from 1.69 to just a few point shy of 1.76 this week. As it seems, the pair is now facing mild resistance at 1.7565. If that resistance is taken out we might the pair reach second bullish target at 1.7651. That can be easily taken out for the greater target at 1.78.
At 1.78 bulls will face stronger resistance as bears would have a certain triple top if they manage to turn the trend and push the price down. That would be a good level to place a heavy short position with a tight stop just a few point over the target. Should bears succeed, first target would be to bring the price to 1.76, below the second pivot point on the long term scale.
This week is certainly not data-heavy so we might see a smooth continuation of the uptrend towards the bullish targets.
Chart: GBP/AUD D1

Economic Events of the Week
This week's event are important turning points for the markets. Beginning with a light Monday and Tuesday with relatively no major news - ECB President will hold a speech today afternoon, and on Tuesday data will be released from Australia - RBA Meeting Minutes, Great Britain - Inflation Reports and the USA - Existing Home Sales. All three of them are not sharply anticipated by the crowds and so they are not expected to move markets that much.

For Wednesday we'll have the monthly FOMC Minutes where we expect no surprises, i.e. rates will be left unchanged so that they can raise them in December.
Thursday and Friday are also on the low key note with a few but no very important events. The last full week of November will most likely be welcomed by the market participants with no excess anxiety and we could expect smooth sailing without spikes in volatility.

Friday, November 17, 2017
Warren Buffett Top Ten Rules For Success
Warren Buffett is the most successful investor of the 20th and 21st century. Named one of the most influential people in the worth he is now worth 78.4 billion. Famous for being a creature of habit, Warren Buffett always does the same route to the office, orders the same breakfast and comes home every day at the same time.
Here are the top ten Warren Buffett rules for success:
1. Find your passion
2. Hire well
3. Don’t care what others think
4. Read, read, read
5. Have a margin of safety
6. Have a competitive advantage
7. Schedule for your personality
8. Always be competing
9. Model success
10. Give unconditional love
Warren Buffett is now a lot more reserved than what he was in his prime. But he still lives every day with high energy doing what he love and he sure can be a role model for a lot of people.
Thursday, November 16, 2017
Gold Consolidates
The consolidation in the metal market continues for a third consecutive week after October pushed Silver and Gold into bearish territory. During October Gold was trading at a high $1,307 and then went to $1,266 before the month ended.
That level was closest to the 200SMA and some support occurred there that moved the price to yesterday's high of $1,288. The move turned out to be somewhat a reflex and the price went down again below $1,280.
This month uncertainty in the metal market is the predominant sentiment and this is seen also in the Silver market where price is range bound between $17.20 and $16.90.
Gold is yet to define a direction and times as these might be used to pile up positions as the market is getting ready to move.
Chart: XAU/USD H4

Wednesday, November 15, 2017
USD/JPY Moves Lower
USD/JPY has been trading to the downside this week with a new lower leg since this morning. The pair reached a high of 114.75 on November 6 and since then it's been going South. The lowest low was reached this morning at 112.65 and the pair seems to have not found any support.
Next level to the downside is seen at 111.66 which would create a double bottom and, if successful, the pair should jump start a new upward move to continue the medium term upside trend.
The Fed announced they are ready to move in December with one rate hike and they did announce it beforehand so that it wouldn't be a surprise to the market environment. This move is already registered by the market participants so no major fluctuations are expected to occur during the news release.
Chart: USD/JPY H4

Tuesday, November 14, 2017
EUR/AUD Closer To Resistance
EUR/AUD continued on its way up in today's Asian and European trading session. The pair moved from 1.5280 in the opening hours to a high of 1.5380. Partially, the rise is due to the speech by Mario Draghi, the ECB President as well as the German ZEW Economic Sentiment (Nov) that actually turned lower than expected at 18.7 vs 20.0.
The pair is currently trading a bit lower at 1.5355 as market participants are anticipating the speech. The Euro moved up against all its competitors this week making a break above the 1.17 level against the US dollar.
We are yet to feel the effect of the panel of central bankers on the markets so have in mind that volatility might ramp up prices.
Chart: EUR/AUD H4

Monday, November 13, 2017
EUR/AUD At Resistance
On the daily EUR/AUD chart it is visible that the price is in a stable uptrend. However, we are able to see that the pairis currently stuck inside a box range below the 1.52235 resistance. Price has been moving sideways for a period of time being trapped below the 1.52235 resistance, along with showing rejections from the ascending trendline and the bullish EMA's.
Price has recently been holding above the 20EMA. Previously we saw price show a fake break of the 1.52235 resistance, where price then fell back below. As price now sits back at the resistance of 1.52235 again we are watching for a potential break. A break of the resistance would lead to potential long positions up to the 1.54700 area.
Tomorrow ECB President Mario Draghi would deliver a speech that could give the pair a direction and either confirm the above scenario or break the support and move downward.
Chart: EUR/AUD D1

Friday, November 10, 2017
Improve Your Trading With SmartOrder 2
Having the right tools to work with is of the key elements to success in trading. This is why it's important to get yourself the best preparation possible. This is where ActivTrades comes into play. They have developed a new application called SmartOrder 2.
Basically what it does is, it provides you with multiple functions that can enhance your trading and bring you closer to your goals. You can close positions at a certain time or reverse them by instrument. You can close positions by equity or by instrument and a whole lot more.
The app is designed to work on MT4 and MT5 and it comes with a handbook for both of the platforms.
SmartOrder 2 is completely free for all existing clients of ActivTrades. However, you can test it out with a demo if you don't have a real account with them.
Use the opportunity to elevate your strategy advance your trading to higher level with the use of SmartOrder 2. For more info just click HERE.

Wednesday, November 8, 2017
USD/JPY Consolidates
Consolidation is viewed as the decision period in any market. Although short term, the consolidation in the USD/JPY indicates that the pair is looking both ways and has not yet decided where to go from here.
The resistance level met at 114.60 was met with favor from the bear camp who sold the pair to a low of 113.63. The pair is now trading at 113.79, just slightly higher than the lowest low. If the indecision persists, we could see the pair gravitate between 114.00 and 113.70.
This week is light on news which could suggest that the consolidation will continue. No major news is sometimes good news given that the healthy behavior of a market is enough to keep the direction going.
On the downside, first support zone is seen at 111.66, on the upside, first resistance zone is the latest high at 114.60.
Chart: USD/JPY H4

NZD/USD Signs of Recovery
NZD/USD suffered a lot of depreciation last month when New Zealand went through a political change that posed insecurities in its financial markets. That's when the pair lost about 400 points against the US dollar.
The support was precisely met at 0.6817. Bulls were quick to react and supported the pair with heavy buying that drove the price to a high of 0.6956. Currently the pair is trading at 0.6913, slightly lower than the highest point reached earlier this week.
If the uptrend continues we might see the pair break the first resistance level at 0.6980. After that, next bull target is seen at 0.72 which would mark a double top. And major target is expected at 0.7500. It is dubious if we would get there before the year end as we are anticipating a rate hike in December and that would, in theory, mean a stronger dollar.
Chart: NZD/USD H4

Monday, November 6, 2017
Economic Data of the Week
Today's week is filled with somewhat light data mainly from the US and Europe. The data is heavily concentrated on Tuesday when we have Australia's Interest rate decision - expectations are to maintain current rate at 1.50%.
The ECB President Mario Draghi will be holding a speech in the morning European hours. After that scheduled for US afternoon we would hear Fed Chair Yellen speaking about the economic outlook.
With the strengthening of the US dollar and the depreciation of the Euro, the fundamentals might come only to reaffirm current positioning in the market.
Other than Tuesday, the rest of the week will have no major influential events so it would most likely be a calm trading environment.

EUR/USD Close to Double Bottom
EUR/USD went down on Friday despite the negative result from the latest Jobs report. The report indicated that new jobs created amounted to 261k, a miss from the expected 310k. Some analysts even predicted 400+ taking into account the latest developments from the hurricane that hit California.
The initial reaction in the US dollar was a sell of as the pair went as high as 1.1690 and stayed there a few minutes after the news only to fall down below prior-to-news level of 1.1655.
The reign of the Euro seems to have went through a tipping point as for the past few weeks the trend has been turning bearish. Current price is now 1.1596, down from 1.1620.
Strong short term support is seen at the previous bottom at 1.1574. If price finds enough buyers at that level we would have a double bottom and a bullish target at 1.17.
Chart: EUR/USD H4

Friday, November 3, 2017
Silver Goes Down
Silver is trading at high volumes and high volatility, currently gravitating towards 16.80. The precious metal lost its highs after the US dollar reacted bullishly to weak US data. The report was a surprise for market participants who expected even higher than the predicted 310K.
Nevertheless, the precious metal sold out and traders and investors jumped on the US dollar to prolong its appreciation.
Silver is expected to hit support at 16.71 as first bear target. If that level does not hold we might see it go for the lower level at 16.42. This level should present more of a challenge than the prior level as it comes at a stronger time period.
November starts with big swings that will likely give direction for future moves.
EUR/USD Down
The US Jobs report that was released earlier today turned out to be lower than expected - 261K, expected 310K. Some experts even predicted 401K but even that negative result could not keep the US bulls at bay.
Despite the result, the US dollar continued on its way to dominance over major currencies marking a new low against the Euro - the pair is now trading at 1.1605. Prior to the news it was standing at 1.1655, went as high as 1.1690 and then went South to current low.
The long term bullish trend on the EUR/USD seems to be exhausted and now the effect can be felt. If the pair continues to post losses, it will break the support level at 1.1540 and then it might go lower to 1.14.
If we see the pair depreciate, it will cancel out the possibility of the pair to be one of the best performing pairs for the year.
Thursday, November 2, 2017
GBP/USD Down, BoE Raises Rate To 0.50%
The Sterling is down triple digits against all of its competitors after the Bank of England decided to hike rates from 0.25% to 0.50%. Since the initial sell off reaction, the Pound has not been able to recover as waves of selling continue to drive the price lower and lower.
GBP/USD is down 1.40%, GBP/JPY is down 1.47% and the biggest losers are GBP/AUD with 1.87% and GBP/NZD with 1.80%. The sell off is far from over as policymakers expect further tightening of monetary policy and that would have a continuous effect on diminishing the value of the currency.
The move may have been a surprise to some as usually raising interest rates means you get more for the money you hold and thus is preferable to hold more. But today's scenario brings back memories from 1992 when George Soros and Stan Druckenmiller sold off what would become the biggest trade in their life. That same trade resulted after the British government announced a rise in the base interest rate from an already high 10 to 12 percent to tempt speculators to buy pounds.
Chart: GBP/USD H4

Tuesday, October 31, 2017
Gold Up
Gold posted some gains after the expected US dollar correction. The precious metal traded heavily on the downside last week and only on Friday did it manage to gain some strength and push through the bearish resistance to post a green candle.
Last week we saw the US dollar appreciate rapidly after comments by ECB President Mario Draghi on future outlook on EU policy. EUR/USD lost some 200 points in the day of announcement and continued to trade in the low range below 1.1580-1.1630.
Now that the US dollar is going through a correction, Gold has the chance to shine again,if only for a while. The recent gains do not seem appealing and the precious metal is still vulnerable to bear attacks. Price shoot up from $1,263 to $1,278 but now it's trading at $1,274.
If price breaks support at $1,260 then we might be heading towards long term support at $1,250. If that level is broken, then we might close the year below $1,200.
Chart: XAU/USD H4

Monday, October 30, 2017
NZD/USD Below Long Term Support
Hard times currently for the New Zealand dollar as the currency depreciated rapidly after political turmoil rattled their financial stability. The above chart is the weekly analysis of NZD/USD.
Market sentiment is overall bearish and seems to be looking for more bearish movement. A break of the current support would lead to potential further shorting opportunities. However we could see a daily lower high which would also be a nice area for a shorting position.
Below 0.68 the bearish movement is expected to continue progressing. Currently the pair is still being sold due to uncertainty and lack of stability. As soon as we have some concrete information about further political and economical development in New Zealand the pair could enjoy some buying that could recover the price to levels close to the 200SMA.
Chart: NZD/USD W1

Friday, October 27, 2017
Trading Forex With ActivTrades
Forex trading is the most overcrowded market in the world. Daily turnover is above 5 trillion dollars. Every bank, fund and country participate in the trade on a daily basis. With the advanced technologies and the modern world we live in, everyone can have access to the same financial markets and be part of the trade.
This, to many people around the world, is the most exciting game. This is why choosing your broker is of crucial importance.
One of the most stable and secure brokers out there is ActivTrades. And you should consider the idea of opening an account with them if you haven't already. Benefits include transparent pricing and no hidden taxes, margin ratio from 1:100 to 1:400. You will have access to major pairs, minor pairs, metals.
In a sentence, if you're looking for a reliable and trustworthy broker with good reputation and convincing history, ActivTrades is your broker. For more info, visit HERE.

Thursday, October 26, 2017
GBP/USD Slightly Up
The GBP/USD pair is trading slightly to the upside as price found the support needed to stabilize itself into the uptrend. The price found support at 1.3100 and then reached as high as 1.3227 before heading down to lower levels.
Currently, it's trading around 1.3200 as uncertainty still remains the predominant market emotion. We would need price to close above 1.3250 in order for the bullish move to continue. On the other hand, if price breaks the support at 1.3120 we are likely to see a continuation of the bearish short-term trend.
Major bear target is seen at 1.3050, while major bull target is seen at 1.3350. The pair has been trading sharply to the downside these past few weeks so we might be in for a corrective rally that would stabilize the price.
Chart: GBP/USD H4

Wednesday, October 25, 2017
Gold Close To Support
Gold is trading relatively close to the support level of $1,272 which could spark bullish interest in the precious metals driving the price up. Recently, it's been difficult for Gold to gain momentum although attempts are not lacking.
The latest move to the upside came in the beginning of October when price reached the level of $1,262 and immediately launched to what would later become a $42 rally.
Now, however, things look more uncertain as the precious metal is feeling weak in the shadow of the strengthening US dollar. As we are heading to December, the Fed is expected to raise rates again which could stimulate the US currency and create lack of demand for Gold.
Chart: XAU/USD H4

Tuesday, October 24, 2017
USD/CAD Breaks Resistance
The long awaited break to the upside from the USD/CAD pair has finally been done. The Canadian dollar went through a disappointing news release on Friday when retail sales turned out to be negative 0.7% instead of the expected positive 0.3%.
The effect was a massive sell off of the pair which resulted in a rally in USD/CAD. The pair gained more than a cent going from 1.2477 to 1.2637 in less than a day.
Currently, it is still gravitating towards its highest point as the pair is now above the medium term resistance that started with the downfall in the beginning of May this year.
First bull target is seen at 1.2665. If bulls take this out, next one comes at 1.2780. Important news are scheduled this week, so paying attention to fundamentals is key.
Chart: USD/CAD H4

Monday, October 23, 2017
US Index Breaks Resistance
On the daily analysis of the US Dollar Index it is clear that price has breached the medium term resistance on the downward trend. As you can see we have highlighted the market structure. Price was forming lower highs and lower lows until recent when we saw price show a break out of the trendline to the upside.
This formed a higher high as shown, price then came back to the downside and formed a higher low. Since we have seen price slowly make its way into bullish territory, showing a strong push to the upside on Friday.
Price is above the 20 & 50 EMA's with only one bullish rejection on Friday. If price continues to the upside, the 20 & 50 EMA's will cross bullish, as they are already touching. The next barrier in the way for the US Dollar index is the daily 200EMA. Then we have the 12125 resistance.
Chart: US Index D1

Friday, October 20, 2017
USD/CAD Sharply Up
The USD/CAD pair reacted sharply to the disappointing news from Canada. Core Retail Sales turned out to be much lower than expected as previous data states 0.2%, expected data stood at 0.3% but real data came out to be -0.7%. The Canadian dollar was immediately sold sharply which spurred a whirlwind of volatility in the currency pairs involving CAD.
USD/CAD is up at 1.2590 from a low of 1.25 prior the release. CAD/JPY is down some half of a cent. EUR/CAD is also up substantial from 1.4760 to a high of 1.4830.
The news are still having an impact as CAD bears are heavily selling the pair by large volumes. The USD/CAD can be expected to find resistance at the area 1.2660-1.2670. If that level is passed, the area around 1.28 is the next target for the USD bulls.
Chart: USD/CAD H4

Thursday, October 19, 2017
AUD/NZD Rises Sharply
The AUD/NZD pair rose sharply in the early pre-opening European hours as New Zealand shunned the incumbent National Party in favor of a coalition government with the Labour Party. This rose fears over central bank policy and long term growth.
The New Zealand dollar is down against all other currencies. NZD/USD is down 1.8%, NZD/CHF is down 2.35%, NZD/JPY also above 2% down.
AUD/NZD is trading some 250 pips higher today, rising with 2.31%. The initial reaction is still not over as the pair is still getting sold all over the market. However, the volumes have been decreasing which indicates that the selling wave is coming to an end. A corrective wave might be expected that will bring some stabilizing to the New Zealand dollar.
Chart: AUD/NZD H4

Wednesday, October 18, 2017
EUR/USD Ahead of Draghi Speech
The EUR/USD is trading somewhat unchanged today gravitating towards 1.1760 in anticipation of the speech by Mario Draghi, the ECB President. The speech will most likely give indications how does the EU stand in terms of stability and future outlook and where the EU economy is headed.
Market sentiment remains bullish for the Euro as technically, the Euro is well positioned and it's stable enough to continue onto its second attempt to conquer the 1.20 level. If we hear positive news from President Draghi, bulls will not hesitate to jump in heavier and push price further up to first bull target at 1.1890. Second bull target is seen at 1.20 and third bull target is seen at the latest high at 1.2092.
On the other hand, a failure to meet market participants' expectations of a positive message, bears might attempt to take control and push it down to last low at 1.1736.
Chart: EUR/USD D1

Tuesday, October 17, 2017
GBP/USD Recovers
GBP/USD is trading to the upside this week as market participants' expectations improve but yet remain cautious about the forthcoming negotiations with the European Union on the Brexit talks. Some researchers predict a catastrophic scenario for the Sterling if they fail to reach an agreement. A fail indeed remains as an option which could actually push the Sterling some 15 cents lower against the US dollar.
On the other hand, however, traders and investors are on the accelerator anticipating that a consensus will be reached and the UK currency will have its chance to appreciate against the dollar.
Whatever the case, current market momentum is predominantly bullish ever since the beginning of the year climbing from 1.19 in January to its highest high at 1.36574 in September.
Chart: GBP/USD H4

Monday, October 16, 2017
EUR/CAD Bearish
On the daily timeframe where EUR/CAD has been forming bearish market structure printing lower highs and lower lows. Recently price showed a rejection off the 1.4470 area which gave it a push back to the upside.
This has not led to the market structure changing, so we are still watching for an overall lower high. As you can see price has current reached as far as the Ichimoku cloud which aligns closely with the 1.48683 resistance. From this area we have seen two rejection candles followed by indecision.
From here we can see the potential of price heading bearish. The weekly candle has also closed showing selling pressure which is a nice further confluence. Bears' first target would be at the 1.43744 support which price came close to previously, this would also form a new lower low.
Chart: EUR/CAD D1

Friday, October 13, 2017
ActivTrades Introduces a New Add-on: SmartTemplate
ActivTrades has now released a brand new tool called SmartTemplate. What it does is it helps you keep track on your strategy by aiming to provide you with useful and highly effective features.
Some of the features include an indication of positions such as long and short based on chart signals as well as determining the main trend, bullish or bearish. This comes with defined time frame in which one should trade.
The tool aims to help both novice and experienced traders as it is designed to be used as a main tool or as a background tool used for reference.
You can get more information on their webpage HERE. It also comes with a useful handbook.

Wednesday, October 11, 2017
Japanese Index Higher
The Japanese Index is trading to the upside as market participants are pushing the price to the all-time high. Price is now gravitating towards the 20800 level which is just a few point shy from the history high 20900. Although the price now feels a bit wobbly, bulls are determined to try and overcome the all-time high.
As the Japanese economy is progressing steadily, fundamentally the outlook is in favor of the higher stock market. If we can get above the history high, bears' attempts to turn the trend could prove futile. Until we get there, however, chances for an inflection point still remain.
Overall market trend is predominantly bullish, both fundamentally with good economic development, and technically with good indications that signal for more growth such as price above the 200SMA and a healthy move to the upside accompanied by corrections.
Chart: JPN IDX D1

Tuesday, October 10, 2017
USD/CHF Edges Lower
The USD/CHF pair is trading to the downside so far this week as the US dollar is posting losses against major competitors. The Swiss Franc is appreciating only slightly as we have not yet seen the full impact by the disappointing US report on Friday.
USD/CHF appears poised to go to the downside, as the US dollar has already lost significant points against the Euro, the Sterling and the Yen. The Swiss Franc is yet to follow in their footsteps on the path of appreciation.
How much exactly, depends on the market. As the move is now in its initial stages, we can expect more bears to pile up and push the price down below 0.9760. Anything below that would indicate that the pair is ready to move lower. Major bear target is seen at the triple bottom at 0.9438.
Unless we get some fresh positive news on the US outlook, market sentiment on the pair remains bearish.
Chart: USD/CHF H4

Gold Higher
Gold is trading higher today after a disappointing US report on Friday. Jobs created came out negative 33K and this sent the US dollar sharply lower. Gold as a safe haven enjoyed a move to the upside initially with some $15.
Currently, Gold is trading at $1,288, marking a $28 move since its bottom at $1,260. If the trend catches on, more Gold bugs will get on thus pushing the price to first target at $1,315. Second major bull target is seen at $1,335 and major bull target is seen at the latest high at $1,360.
If $1,360 is taken out, then we might conclude that the bearish short-term trend is over and the new upward trend has initiated.
Silver is also posting gains as the metal is now trading at $17.09, up from a low of $16.35.
Chart: XAU/USD H4

Monday, October 9, 2017
EUR/USD Bounced Off Two Fib Levels
The EUR/USD pair saw a significant reaction by the market on Friday when the US released mixed results on the economy. Jobs created was a negative 33, while wages growth turned out to be higher than expected - 0.5% vs 0.3%.
This divergence in the economy initially boosted the US dollar while sending Gold and Silver in the red. However, after a few hours, the trend turned and the US started the depreciation process. EUR/USD touched upon both the long-term Fibonacci and the short-term Fibonacci levels, which happen to coincide in the 1.1698 to 1.1678 range. The long term downward Fib level is the 38.2%, while the short-term upward level is 23.6%.
EUR/USD is seeing optimism from the market going as high as 1.1747, currently trading at 1.1742. The pair might continue to trade higher if the Fed does not move in December, as analysts are predicting that the rate hike is in the bag to be used before year end.
Chart: EUR/USD H4

Subscribe to:
Posts (Atom)