Smart Forecast by ActivTrades is a tool that offers integration of chart retracements and market trend analysis. Combined, they offer a very powerful and effective trading strategy.
The tool is developed solely for MetaTrader 4 and is already one of the most advanced out there. Some of the features offered in the interface of the Smart Forecast tool are:
Market Strength, Daily Market Trend, Average Line, Support line, Resistance line.
All those elements compound to a strategy that is simple, yet very promising. As traders, it's important for us to have the right tools before we make a decision and this tool is definitely on the list.
For more info, just click here.

Friday, April 28, 2017
Thursday, April 27, 2017
Gold Declining
Gold has been declining for the past couple of weeks due to a strong technical boundary. The precious metal reached the level of $1,295, which comes just a few points above the resistance. Since then it started to depreciate with rapid pace to a low of $1,259.
Currently, Gold is trading at $1,264, some $30 lower than it's 6 month high made on April 17. The precious metal still needs the support of the bullish camp, moreover now when it's right at the 200SMA.
Weekly time-frame shows how strong the resistance really is. We see that the latest high came at the same resistance line that goes back to the all time high of $1,920. If we can get past $1,300 we might see a renewed positivism in the Gold market.
Chart: XAU/USD D1

Wednesday, April 26, 2017
GBP/JPY Rallying
GBP/JPY has been trading to the upside for the past couple of weeks as price advanced from 135.57 to the latest high made yesterday at 143.01. The Sterling rallied on the news that the United Kingdom will be having General election on June 8.
Market participants favored the announcement made by the UK Prime minister Theresa May and the Sterling climbed up against all of its competitors.
Currently, the GBP/JPY pair is trading somewhat lower at 142.70 but momentum is still bullish and has the potential to bring the pair up to resistance at 144.00.
If that level is reached, bears may take action and try and bring it down to potential first target at 142.50. On the other hand, if bulls are able to keep the momentum going, the pair may go to a high of 145 as first target.
Chart: GBP/JPY H4

Tuesday, April 25, 2017
GBP/USD Sideways
The Sterling is close to its 7-month high as the GBP/USD pair has been rallying on technicals and fundamentals combined. On the technical side, the pair registered a low of 1.1920 on Oct 7 and since then it has been trading in the wide range between 1.20 and 1.27.

The pair had a double bottom at 1.1980 on Jan 16, ever since then it's been swinging for the fences. Latest high was registered a few days ago on April 19 at 1.2902. Current market price is 1.2811 and it appears that the price has consolidated in the last week around 1.28-1.2850.
Main trend remains strongly bullish and if the bulls manage to go above the resistance line at 1.2950 we might see a renewed momentum to the upside.
On the other hand, bears might try and use this as an opportunity to push it lower to first bear target at 1.2730.
Chart: GBP/USD H4

Monday, April 24, 2017
EUR/USD Spikes Above 1.09
For the first time in 5 months the Euro went as high as 1.0920. The pair reacted to news coming from the French election day where the French nation chose Macron as the first one to go to second round against Le Pen.
The different views of the candidates are what made the spike in the Euro Dollar so obvious. Macron is Pro-European and focused on close partnership with the European union, whereas Le Pen has the potential to create a Frexit, after the Brexit.
Macron boosted the European currency as well as European stocks. The Euro went as high as 1.0920 against its major competitor - the US dollar. Currently, trading price is gravitating towards 1.9865.
Main trend on the short-term remains bullish.
Chart: EUR/USD M15

Friday, April 21, 2017
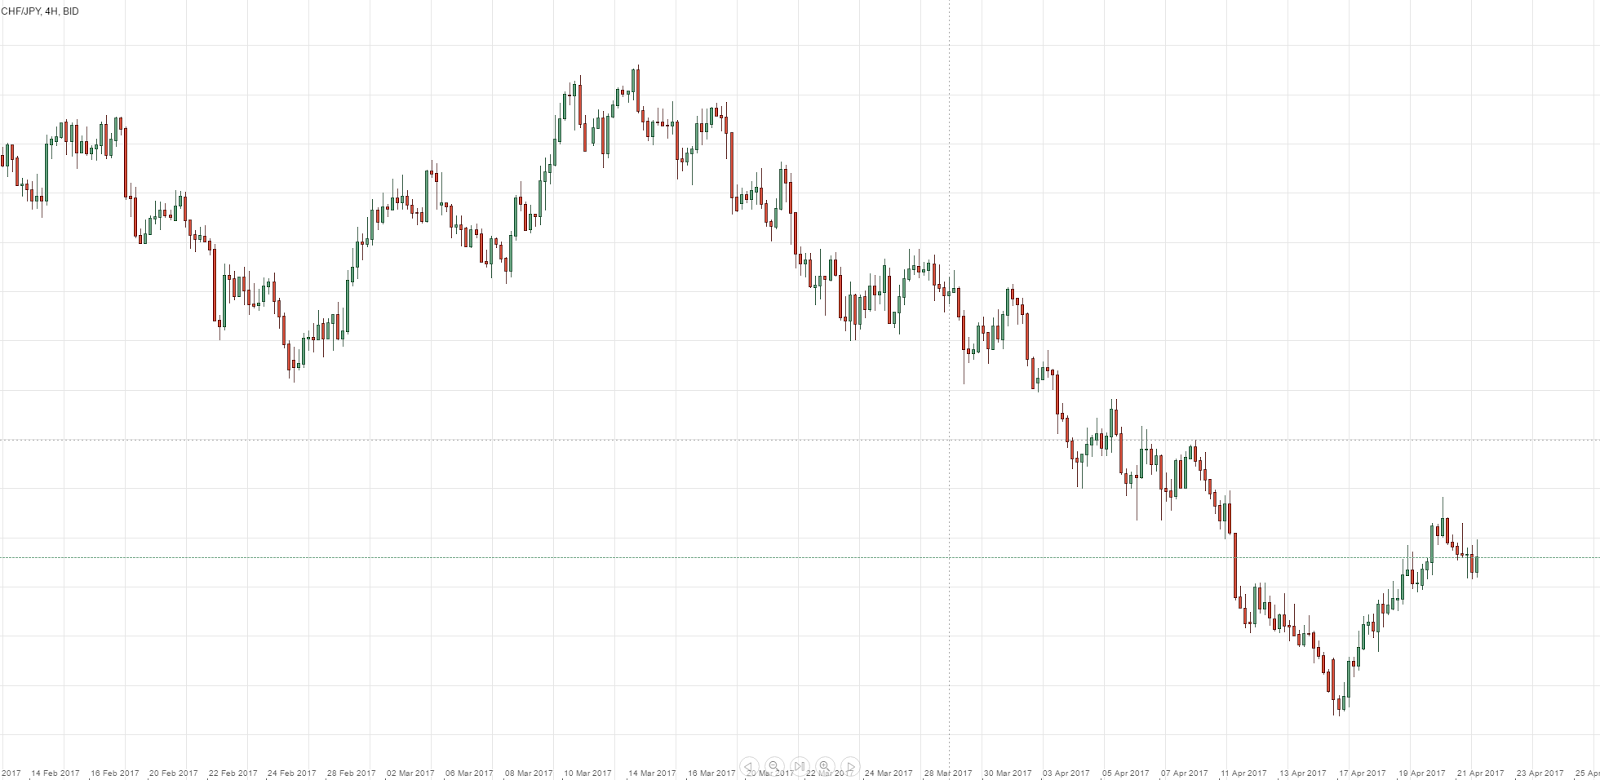
CHF/JPY in Consolidation
CHF/JPY is on its way into consolidation gravitating towards the 109.00 level. The pair is entering into the weekend slightly higher today at 109.50. It is worth to note that the highest point after the drop was reached yesterday at 109.91. Main trend on the short term remains bullish as CHF/JPY has been going up since the middle of the month starting from 107.70.
The pair went from 114.31 on March 14 to 107.70 on April 16. If it keeps depreciating, bears will try to reach and form a double bottom at 107.70. On the other side, if bulls decide to get in, then they will try to push the price to a high of 110.50 and form a double top.
The Japanese Yen has been trying to stabilize itself recently, holding steady against the US dollar and other major peers.
Chart: CHF/JPY H4
Thursday, April 20, 2017
USD/CAD Up and Running
USD/CAD is trading to the upside this week as price reached a high of 1.3489. The pair seems to have gathered enough momentum to keep it going. The Canadian dollar has been weakening and this is the main reason the price is advancing.
On the other hand, the US dollar is also having a period of depreciation as it is losing points to its peers. USD/CAD reached the 200SMA last week at 1.3223 and is now getting closer to the double top at 1.3534. This would be a good time to enter short in the market.
If that level of resistance holds, first bear target is seen at 1.3240, which would be a retest of the 200SMA. Next target would be the support line at 1.3140. If the bulls turn out to be stronger, price will be heading to major bull zone at 1.3842.
Chart: USD/CAD D1

Wednesday, April 19, 2017
USD/JPY Supported
USD/JPY has been trading to the downside ever since it reached its peak post-elections when Trump became president. The pair reached a high of 118.60 on Dec 16 and then slowly started to depreciate until recently when it made its lowest point at 108.11.
The pair is now 108.99 and it seems that the support level has successfully managed to hold the bears from destroying the trend. More important, however, is the fact the Yen has been depreciating against all of its peers.
The Yen is trading at support against the Australian dollar as well so we might expect a change in direction. The GBP/JPY pair is the only one that is going to the upside due to the unexpected announcement about the UK General Elections in June.

Tuesday, April 18, 2017
GBP/CHF Roller Coaster Ride
The speech by the UK Prime minister Theresa May focused on holding general elections on June 8. The news initially drove investors away from the Sterling but just a few minutes before the speech ended, the Sterling skyrocketed leaving all bears caught by surprise.

One of the most influenced pairs was the GBP/.CHF pair which reacted bearishly right at the resistance line at 1.2640. The pair reached a low of 1.2551, then spiked to a high above 1.2683.
Economic growth, according to Theresa May, has exceeded all expectations and the leaving of the EU would not be a disaster as expected by many people.
Other GBP pairs were also influenced by the speech. GBP/USD is now 1.2664. Overall, a very positive reaction in the Bullish camp of the UK currency.
Chart: GBP/CHF H4

Monday, April 17, 2017
USD/CAD Consolidated
USD/CAD reacted strongly to last week's support when the pair briefly touched the support line at 1.3220 and then went to the upside. The gains, however, might turn out to be short-lived. After the initial impact, USD/CAD went to a high of 1.3342 and then the momentum disappeared.
The latest lower than expected US data that came out on Friday, the CPI and ARS, reflected in the price of the US dollar. USD/CAD is currently trading at 1.3297, down some 50 points until now.
The opening hours of today's session can be described as hours of low volatility and insignificant moves that could help traders and investors gain some insight about market sentiment and overall market conditions.
Char: USD/CAD H4

Friday, April 14, 2017
Account Features | ActivTrades Review
ActivTrades is considered one of the most known and popular brokers worldwide. With its wide variety of market exposures, platforms and account settings, they have a lot of advantages compared to other brokers.
Here are some of the most important features:
1. ActivTrades offers accounts that start from as little as £100.
2. Losses on the account cannot exceed your deposits.
3. Your funds are protected up to £500,000. This is one of the highest capital protection levels in the market.
4. No account charges or platform fees, meaning you have no dormant fees and you not forced to execute trades in order to keep your account alive.
If you are looking to choose a broker for the first time or you're just unhappy with your current broker, feel free to give them a try, you will most certainly be surprised how much attention you get.
To learn more about all account features just go here.
Thursday, April 13, 2017
Gold Trading At Upper Trendline
Gold reached it's highest point since the election day in the US on Nov 9. The precious metal then reacted bullishly to initial results and after that went downhill due to the strong US dollar and rallying US equities.
Gold made a low of $1,122 on Dec 15 last year and since then it has been gaining in price. Gold is now $1,287 and is trading at the upper trendline on the medium term outlook.
If the level holds, we might see bears taking over the Gold market and pushing the price down to a first support zone at last low of $1,246. However, the trend seems solid and we might more likely see the metal going higher to a first and very important level - $1,300, the psychological target.
Tomorrow's US data might give the metal a more certain direction.
Chart: XAU/USD H4

Tuesday, April 11, 2017
Gold Close To Upper Trendline
Gold looks ready to regain investors' confidence as US equities consolidated and the US currency is weakening due to lower than expected economic data. Last week the NFP failed to deliver something to hold on and the effect is only now starting to be visible in the markets.
Gold made its last low at $1,247 and is now trading at $1,257 with a daily high of $1,258.70. The precious metal has been rallying since $1,195 in the beginning of March. Now, one month later, Gold is at a high of $1,270.67.
If the US dollar continues to depreciate, Gold will continue to appreciate. First target for the bulls is seen at last high of $1,270, which also can be considered a triple top by some analysts. After that level is reached, next target is $1,288 and then the psychological $1,300.
Chart: XAU/USD H4

Monday, April 10, 2017
USD/CHF At Resistance
USD/CHF is trading at resistance today. After the opening of the US session, the pair slowly started to depreciate, so far confirming the change of trend. USD/CHF appears to be looking South as price is getting back into the descending trading channel.
Current market price is 1.0080, intraday high reached 1.0107 and that was the moment when bears took control and brought it down again. It is still early to confirm that the pair has changed direction. It would be a good indication if today's close is below 1.0080.
Should the bear take over, the pair is expected to go below parity. Short term target is seen at 0.9953 while major bear target is seen at 0.97. The latest US news indicate weakening economy and that could be enough to drive investors away from the US for a while until economic conditions improve.
Chart: USD/CHF H4

EUR/USD At Support
EUR/USD is trading at support in the early European hours of today's session. The pair is currently trading at 1.0583 with a low of 1.0570. Bulls are now trying to bring it up backed by strong fundamentals and strong short-term technicals.
What gives bulls confidence is the lower than expected non-farm payrolls - 98,000, well below expectations of 180,000. The US dollar, however, did not react negatively at all and it kept appreciating against the single European currency.
The pair is looking to appreciate if current level holds. If the US dollar goes below 1.0550, then the bullish run would be considered invalid. Bulls have the upper hand in the situation and are looking to potential first target at 1.0690.
Chart: EUR/USD H4

Wednesday, April 5, 2017
GBP/USD Neutral
GBP/USD is not showing any clear signs indicating where it will head next. After Article 50 was triggered, the pair did not react in any way thus causing traders and investors to guesswork their direction.
What actually happened after Art 50 was a consolidation in a narrow channel between 1.2570 and 1.2370. The pair is now trading at 1.2482, right in between the upper and lower trading line.
Major bull target is seen at 1.2670, while major bear target rests at 1.2040. Today's GBP news turned out to be positive for the UK and that reflected in appreciation of the pair, but only mildly. Sterling bulls will need something stronger in order for them to power through and reclaim their level above 1.27.
Chart: GBP/USD H4

Tuesday, April 4, 2017
NZD/USD Breaks Support Again
NZD/USD is having a hard time recently trying to keep up within the upward trending channel on the long term outlook. The pair reached support in the beginning of March at 0.6955 and went below the channel. Then somehow it managed to get back in sharply. Unfortunately for the bulls, the pair was inconsistent and started trading sideways until it gave up.
Today, the pair broke the support level again, indicating that the move to the downside may not be over. Price is now 0.6975 and the bearish momentum continues to gain strength.
First bear target is seen at latest low at 0.6885, while bulls' target is to get back in the trend. The economic US news this week might give a hint on the direction of the pair.
Chart: NZD/USD D1

EUR/USD Backed By Support
EUR/USD had some bad days recently as price went down with more than 250 points in the last couple of weeks. The pair went from 1.09 to a low of 1.0635 in a matter of a few days due to strong data coming out of the US. Also, technicals played a significant role as the pair circulated around the 200SMA. Bulls were unsuccessful in their attempt to go beyond it and bears took over.
The pair hit the prior pivot point at it's lowest today and was immediately backed up by the bulls who took the chance to go long and buy the dip. Price is now 1.0655 and has a good chance to continue up for the short term.
However, if bears break the support at 1.0630, the pair will most likely be vulnerable and this will increase the chances for it to go South.
Chart: EUR/USD D1

Monday, April 3, 2017
USD/CAD at Resistance
USD/CAD is having a strong start of the month with price going to a high of 1.34, up from 1.3284 in the end of March. The US dollar is stronger now due to positive US data and sustained optimistic outlook for the economy under the Trump administration.
All this means that the rally of the US dollar might be injected with a new dose of enthusiasm, causing all USD pairs to move in favor of the Greenback.
USD/CAD won't be an exception. The pair needs to close above 1.3415 in order for the bulls to have a good outlook with major target somewhere between 1.3585 and 1.3690.
Short term, the pair is expected to consolidate around 1.34 and 1.3250, only after we get a break out of either sides, the pair could be expected to pick a direction.
Chart: USD/CAD H4

Gold Above $1,250
Gold is having a volatile Monday with open price at $1,246, a low of $1,244 and currently trading at its highest - $1,252. The precious metal is trying to beat the odds and had a very strong first quarter despite the many analysts and market experts who predicted that the US dollar will push down the price of Gold.
Since the start of 2017, Gold is up about 8.70%, or just a bit over $100. Gold opened at $1,150 and had it's high in the end of February at $1,264. Main trend on the short term remains strongly bullish. First level bulls need to take care of is $1,265, then comes $1,290.
Bears will use the opportunity to sell at $1,265 which means that the same is a good short entry. Bears major target is the 38.2% Fibo at $1,210.
Chart: XAU/USD H4

Subscribe to:
Posts (Atom)