Thursday, December 31, 2015

Gold At Year End

Gold is about to close the yearly candle just some $10-$15 dollars above its lowest for the year ($1046). Low volatility can be expected in the rest of the last trading day of the year with most of the traders and investors already enjoying their winter holidays.

As to you, I would like to thank you for reading my blog and I promise to keep providing you with quality content based on evidence and the art of technical analysis.

May the sweet taste of success fill up your life throughout the new 2016.

Love,
Rozen

Chart: XAU/USD D1


Silver At Support

Silver is trading at support level for the past few days with prices piercing slightly below it and then recovering back above it. While bears are trying to beat down the bullish impulse, market sentiment is still neutral as this is the level where price would decide the direction based on supply and demand. 

Currently, Silver is trading at 13.87, but sharp moves to both sides can be expected in the first trading days in the new year. 

Chart: XAG/USD D1


Tuesday, December 29, 2015

GBP/USD Close To Support

The Sterling Bulls are having a disastrous time. A couple of months ago price was targeted to reach 1.55 before the end of the year from a lot of experts and analysts. The saying of Jesse Livermore "the market is designed to fool most of the people most of the time" holds true in this case specifically. 

Price retreated to even lower than before reaching 1.4785 in today's session. While this might be a good buying opportunity, you may want to wait for the pair to first bounce off the support level, as shown in the chart below.

Chart: GBP/USD D1


Gold Range Bound

Since the beginning of November, Gold has been trading in a seemingly tight range for its capabilities. $1,097 and $1,046 are the high and low levels for the precious metal for two months, Currently, Gold is trading at $1,068 with only mild fluctuations of about five dollars for the past few days.

The reason behind Gold not doing anything grand is that most traders and investors are outside the markets right now and low volumes create low volatility. It's interesting to observe what the closing price of the year would be!

Chart: XAU/USD H4


Wednesday, December 23, 2015

AUD/NZD Saved By Support

The pair reached the support zone a few days ago. Yesterday we posted the analysis where we talked about price hitting support and reacting positively to it. Well, today we have a confirmation, at least in the short-term, that AUD/NZD is headed north.

Today's trading session gave a good momentum and price reached 1.06800 while only yesterday it was trading at 1.05800.

Stable support zone now is 1.06000 while first resistance is to be expected at 1.06900.

Chart: AUD/NZD D1


GBP/USD Support

Has the long ride of the bears come to an end? It look so according to the daily chart. Price was caught in a downtrend from 1.5250 to 1.4790. Yesterday, however, bulls decided to take the wheel and GBP/USD was only able to touch the support line after which the pair started gaining.

Thus far, price has slightly recovered, but a long way is yet to be covered. First resistance zone might be expected aroung the 1.50 level.

Chart: GBP/USD D1


Tuesday, December 22, 2015

AUD/SGD Yet To Be Decided

The faith of this pair is on a crossroad between the north and the south. Currently, AUD/SGD is trading at resistance zone and a clear direction is yet to be defined. 

It is too early to pick a trend so it would be best to wait for clearance once price heads in a certain direction. 

Levels: First support is at 1.01020, second is 1.00176 and third support appears to be 1.00086. 
First resistance is at 1.01835, second is 1.02194 and third resistance appears to be 1.02687.

Chart: AUD/SGD D1 


AUD/NZD Hit Support

The pair is trading at support for a fourth consecutive day after it touched the support line on Thursday. Currently AUD/NZD is trading around 1.0600-1.0620. It seems bears are having a hard time trying to push prices below daily support at 1.0600.

The lowest it got was today's low at 1.0578 but bulls gave a good effort and immediately brought the price back into the channel.

Second level of support is 1.0578, third level appears to be 1.0496.

Chart: AUD/NZD D1


Friday, December 18, 2015

Gold Posts New Losses

Gold has been having a bad time ever since the FED rate hike took place. The moment the decision was announced Gold made a $15 spike only to recover seconds later. The after effect, however, turned out to be strongly bearish for the precious metal.

Gold went from $1,079 to $1,047 in less than two days posting the quickest loss since November 16. Currently, Gold has recovered slightly and is trading at $1,055. Its future is yet to be decided, but with a strong bearish market sentiment and the strong US Dollar, we might witness an attempt to reach the zone aroung the $1,020 mark.

Chart: XAU/USD H4


USD Gaining Strength

The US Dollar posts new earnings in today's trading session. After the FED decision to raise rates, the Greenback is witnessing good support pushing the EUR below 1.08.

With this pace a break below 1.0790 could lead to an attempt to test first support zone at 1.0760. If this level does not hold, price is bound to go to 1.0630.

Currently, the EUR/USD is trading at 1.0815. Today is a non-event day, which means that there will be no market movers and shakers. Enjoy your weekend!

Chart: EUR/USD D1


Wednesday, December 16, 2015

From One Quarter To One Half

At long last, a rate hike for the history books. The Federal Reserve has raised the interest rates for the first time in 9.5 years.

In a landmark step, the US central bank announced a quarter-point increase in the target range for the federal funds rate to 0.25-0.5 per cent, lifting it from the historic lows it has occupied since December 2008, when the US was mired in an economic crisis that would ultimately drive unemployment to 10 per cent.

 The increase comes amid signs of a steady US recovery, with consumer spending growth holding firm and unemployment standing at just 5 per cent, lower than the 5.3 per cent rate that was prevailing when the Fed last kick-started an interest rate-raising cycle in 2004.


Gold Slightly Up Before Last FED Meeting

Gold is trading a bit higher in today's session due to high expectations and concerns regarding the FED decision which is to be expected in less than 5 mins.

This is the last FOMC Meeting for the year which could turn into a very very historic event for the last decade.

Can we get the first FED rate increase in nearly 9.5 years?

Chart: XAUUSD D1


Tuesday, December 15, 2015

EUR/USD Lower After Upbeat US Data

The EUR/USD is trading lower since the news came out today. 

USD Consumer Price Index (YoY) (NOV): 0.5% actual vs 0.4% estimate, 0.2% prior. Currently the EUR/USD is trading at 1.0970, prior to 1.0990. 

Keep positions closely observed as tomorrow we might witness higher than usual volatility due to the last FED meeting for the year where we might see a raise in the interest rates. 

Technically, prices are sliding on the 200SMA implying that a big move to either sides is a possibility.

Chart: EUR/USD D1


Friday, December 11, 2015

Personal Trading Strategy

As we very well know, today's technology allow for trading directly from your home. Thus, you do not need a middle man to do the job for you. To rely on your own abilities, skills, experience and knowledge, however, you need guidance.

Such guidance can be found in ActivTrades webinars, just as the last one called The Four Pillars of Personal Trading, by Malte Kaub.

In case you missed it, worry not, for you have the schedule posted HERE.


Thursday, December 10, 2015

GBP/JPY Broke Support

The pair is trading below support since today. It broke the major support on December 8 and since then it has not been able to recover above it. Instead, bears are pushing even lower with prices touching 183.35 today and GBP/JPY is trading below 184.25 - major support level.

Should price continue trading further down we might expect a new bottom around 181.90. It is more likely, however, that bulls will try to regain dominance and push prices above support.

Chart: GBP/JPY D1


USD/JPY Sharp Decline

The pair has been undervalued for the past few days trading rapidly to the downside. Although the pair is trading really close to major support, the possibility of a break out below it remains strong. Currently USD/JPY is trading at 121.30-something, raising bulls' hopes to buy at the bottom around 121.

Consider the fact, that if you would want to open a heavy position to either sides, extreme volatility is bound to take place on December 15 and 16 caused by the last FED meeting for the year.

Chart: USD/JPY H4


Tuesday, December 8, 2015

CAD/JPY Broken Triangle

The pair breached the support level yesterday by trading significantly below the triangle formed on the daily chart. With price below critical support, CAD/JPY might attempt to go for lower levels, targeting the 87.50-87 price range.

First support appears to be 90.50, second support is 89.70 and third and strongest support is 87.50.

As to resistance: 92.20; 93.10; and third and strongest is the 200SMA at 95.00.

Chart: CAD/JPY D1


Monday, December 7, 2015

CHF/SGD In Uptrend

The pair is trading heavily to the upside since the last few days. It bottomed at 1.3660 and then took off to reach a high of 1.4111. Currently CHF/SGD is trading at 1.4034. First resistance would be the level of 1.4260. If this level is breached, then we might witness an attempt to go for 1.53 and beyond. 

On the other hand, should bears decide they took enough beating, price might retreat to previous lows of 1.3660 and below. 

If you don't feel confident in taking a long CHF/SGD you might want to hedge by shorting EUR/SGD. 

Chart: CHF/SGD D1


Thursday, December 3, 2015

Beautiful Harmonic on NZD/CHF

This formation is one of my favorites. It is relatively rare, but when present it makes sure it is there to please. The harmonic pattern is a powerful design in the markets. It can currently be observed on the daily chart of NZD/CHF.

Price reached peak, started to go down, then tried to gain back what was lost and failed only to slowly go to the golden ratio and then plunge. Beautiful.

Chart: NZD/CHF D1


CHF/JPY At Resistance

The pair is trading exactly at the long term resistance at 122.50-122.70. Have in mind that today was a day filled with high volatility caused by the Euro. Its impact was felt all over the markets and CHF/JPY was not an exception.

The pair was heavily traded for the past few hours and bulls managed to reach the potential sell zone at 122.50. Currently price is still trying to pick a direction, one problem is the high volatility, so if you want to take any heavy positions, first wait for the noise to pass and open your position in silence.

First resistance - current market price (122.50), first support - 121.80.

Chart: CHF/JPY D1


Tuesday, December 1, 2015

Gold Humble

There has been a lot of controversy whether Gold is going to rise or fall. One thing is for sure, though, it is exceedingly underpriced. And so far it does not look like it has bottomed yet. This month will be crucial for the markets as we expect the FED to raise rates and change the game as we know it.

It would be best to restrain from heavy positions in Gold and Dollar-related instruments until noise passes and silence takes its place.

Back to Gold. It has found resistance on the upper trend line on H1 and is currently trading below it at $1,065. Bearish sentiment remains the leading reason for the price to continue losing ground as we see traders and investors head to Dollar. Next stop to the downside would be slightly below $1,050 and first stop to the upside would be $1,075 if resistance level is broken.

Chart: XAUUSD H1


EURUSD Still Holding

Not much has changed for the past few days for the EURUSD. The pair has been range trading between 1.0570 and today's high 1.0636. With nothing to back up the Euro, the Dollar is bound to continue thriving and taking up more and more space down south on the chart.

Currently, EURUSD is trading at 1.0616, while support remains closely at 1.0550 and resistance rests even closer at 1.0640.

Chart: EURUSD D1


Monday, November 30, 2015

AUDUSD Yet To Be Decided

The faith of the AUDUSD pair is yet to be decided as it reached a heavy milestone by hitting near 0.73 and then returning back into the downward trend started on September 4. The pair reached as high as 0.7282 on November 25 and is currently trading at 0.72.

If the strength of the U.S. Dollar continues then this level would be hard to breach and price may continue falling below 0.70.

Currently, support rests at 0.7138, while resistance is last high of 0.7282.

Chart: AUDUSD D1


Friday, November 27, 2015

Trading Tool

Trading tools are especially useful, given the fact that you have defined a clear and reliable strategy. One of those tools is called Pivot Point Indicator. Basically what that means is that it does the job in selecting Support and Resistance levels. If price is above the given pivot point, market is considered bullish, below it - bearish.

This tool might be really useful for spotting a change in trend, a market turn, where the biggest money are made.

To know about this visit ActivTrades' Pivot Point Indicator page HERE.


GBPUSD At Support

Is the downtrend in the Cable gone? According to daily chart the pair has reached the support line and has stayed there for the past four days.

Should we witness a close below the support line price may try and reach levels around 1.49 which would be a continuation of the bearish movement started on November 19.

On the other hand, as we can see prices are trying to hold onto the level of support and if they manage to bounce from there we can have a green light to go to 1.5370.

It is important to follow what price will do today and on Monday.

Have a beautiful weekend, everyone.

Chart: GBPUSD D1


Thursday, November 26, 2015

USDCHF above resistance

The pair is trading higher in today's trading session witnessing a lot of bulls giving rise to prices. With an opening price of just below 1.0200 USDCHF made a high of 1.0247 thus far for the day.

Expectations are that prices will continue to gain. So far we are witnessing a 7th consecutive day in which prices are trading above the resistance.

Sentiment remains strongly bullish and if we get above the 1.0250 level price may want to try and top 1.0300.

Chart: USDCHF D1


Wednesday, November 25, 2015

Gold Unchanged

The precious metal is trading at the same range between $1,080 and $1,068. Not much has happened thus far this week as traders and investors are holding to the price which is at the support level just a little below $1,080 - $1,076.

Currently, price is still to decide a direction, so I would wait before entering into a position.

First support is $1,065, first resistance is $1,082.

Chart: XAUUSD D1


Monday, November 23, 2015

EURUSD At 8-Month Low

The Euro is trading at an 8-month low in today's trading session. Fundamentals and technicals combined are the reason for eurusd to trade as low as 1.0600. This is the lowest since April 15 this year when the pair was in a bullish trend since March 16.

This time, however, the end is nowhere to be found as Europe does not have anything to offer which could back up their currency. The US Dollar is bound to thrive in such case.

First level of support is seen at 1.0550. First resistance is to be found at 1.0700.

Chart: EURUSD D1


Friday, November 20, 2015

Paul Tudor Jones Quotes Pt 2

We continue with our second part of Paul Tudor Jones' wisdom, so here are a few more one-liners from this brilliant trader.

"Losers average losers."

"You adapt, evolve, compete or die."

"If trading is like chess, then macro is like three-dimensional chess."

"Failure was a key element to my life’s journey."

"At the end of the day, the most important thing is how good are you at risk control."


Paul Tudor Jones Quotes Pt 1

Today we take a look at one of the most successful traders of all time - Paul Tudor Jones. With current net worth of above $4 billion he is considered to be the best trader of our time. Here are some of his best wisdom nuggets:

"Don't focus on making money. Focus on protecting what you have."

"I try to avoid any emotional attachment to a market."

"Your job is to buy what goes up and to sell what goes down."

"The most important rule in trading is to play great defense, not great offense."

And my favorite one:

"Every day I assume every position I have is wrong."

Stay tuned for part two!


Wednesday, November 18, 2015

Is Oil Going To Hold?

For just a brief moment two days ago Oil touched its lowest low of $40. This was taken as the necessary level of support by traders and price reacted by going more than $2 higher to reach a high of 42.17. Currently, Oil is trading around the $41 level and is still unsure of a definite direction.

Daily volatility is very high with price fluctuating more than $2 up and down so if you plan to open a position, make sure volume is low and stop is wide.

First level of support is 40.20 while first level of resistance is 42.20.

Chart: USOil D1


EURUSD Close To Support

The pair went as low as 1.0630 in yesterday's trading session to slightly recover and is currently trading at 1.0660. Traders and investors are still optimistic about the U.S. Dollar and the Euro is losing ground amid bearish sentiment since its last high at 1.1497.

With the possible rate raise on the table the Euro is destined to continue falling, while according to some analysts it will dive below parity should we witness a raise this December.

Have in mind that in less than 5 hours high volatility might stir the markets as we have the FOMC Minutes.

Until then, support rests at 1.06. Resistance is 1.07.

Chart: EURUSD D1

Monday, November 16, 2015

Gold Gained and Lost It All

In today's trading session Gold opened at $1,083.48 and climbed to the impressive $1,098.

On the one hand, this was because of the attacks in Paris and the reaction of all political leaders in Europe, as well as the US President to tighten the measures against terrorist attacks and provide better control.

On the other hand, Gold rose because of technical factors. Price reached $1,074, the low since August 24 thus forming a double bottom.

Currently, Gold is trading at $1,086, $12 lower than today's high. Hopes are not yet lost for higher prices, but Bears might want one last dance to push prices below $1,070 and should this happen, the yellow metal might also test the so-spoken-about level of $1,000.

Chart: XAUUSD H1


Friday, November 13, 2015

Technical Analysis Webinar

As you probably know, two types of analysis exist in the Forex market. Fundamental and technical. In order to be successful, you have to master both of them and learn when to forget one and stick to the other and vice versa.

To my own understanding, it's best to use both in trading, but if I had to pick one over the other, I'd choose technical analysis. Patterns, channels, lines, support, resistance, formations such as tops and bottoms, head and shoulders, etc.

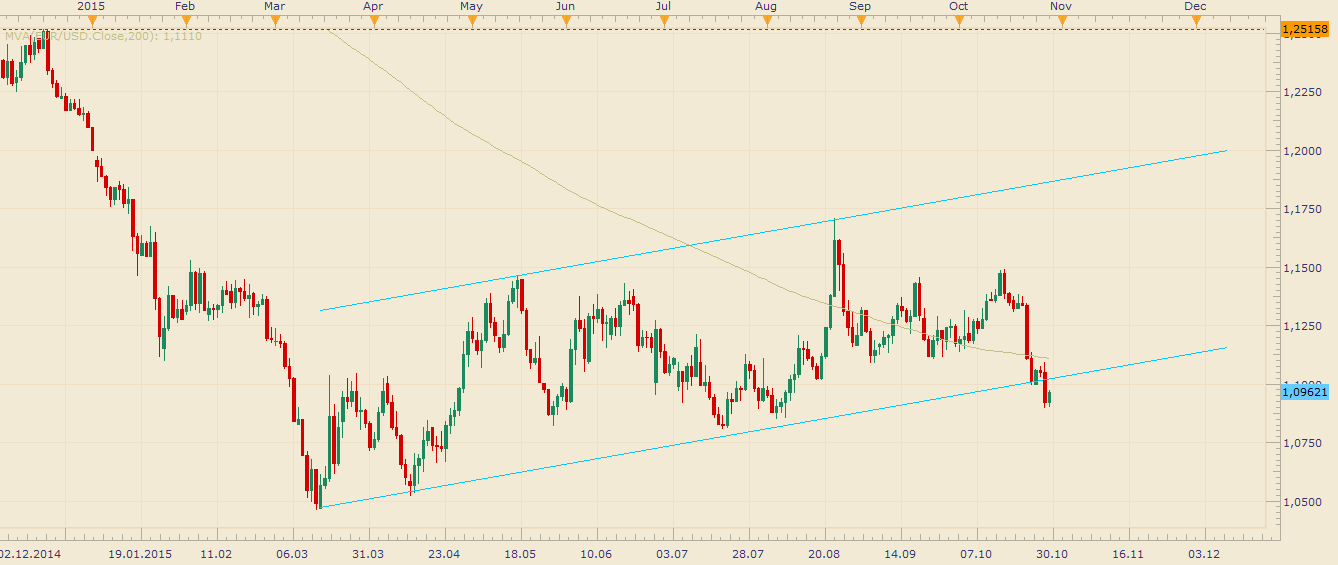
I'm sure that all who watched the ActivTrades webinar were not disappointed to find out about the vast opportunities these patterns allow. This week's seminar was called Price Action Patterns and was hosted by Rishi Patel on ActivTrade's page here.

If you are interested, you can simply follow next events on this page and make sure you register beforehand so you could be on the winning side of the trade next time!


Thursday, November 12, 2015

Oil losing ground

Black Gold is again below $43 and is trading even below yesterday's low of 42.34. Today so far price reached a low of 42.15, the lowest since August 28. According to technicals, there is a possibility that Oil may try to reach the area around $41 before going on the upside again.

Currently, Oil is below the upside support at 43.68 and with no major news to stir the market, it is probably going to keep trading lower.

Chart: USOil H1


Wednesday, November 11, 2015

Oil At Support

Oil is trading lower in today's early European session with price below 43.80. Price is yet to test support at 43.50 as it has already done so a few times this week. Oil seems to hold strong above 43.50 so a break below this would indicate that further down move is to be expected.

First level of support is 43.50, while first resistance is 43.90. This is the range Oil should break in order to define a possible new short-term trend. Second level of support is 43.10 while second level of resistance is 44.40.

Chart: USOil D1


Tuesday, November 10, 2015

AUDUSD At Support

The pair is trading at the major support level for the past couple of days. AUDUSD reacted on the far above expectations NFP's and reached a low of 0.7023 on Friday. Currently it is trading around 0.7055 holding above the support level of 0.7020. Below 0.70 bears will have taken dominance and trend would turn bearish. So far, this has not happened and bulls still have a slight short-term advantage with price holding above support.

Strong resistance is seen at 0.72.

Chart: AUDUSD D1


Monday, November 9, 2015

Gold Below $1,100

Gold broke the psychological level of $1,100 on Friday with far above expectations NFP's. Immediately before the results were published, Gold was trading around $1,105 and then drastically declined more than $10 in less than a second circulating for a while around $1,092-$1,094.

This wasn't enough for the bears so they pushed the price further down with $7-9 more to form a bottom of $1,085.

Now, Gold is taking a breather trading around $1,094 with really tight volumes. First level of support is $1,077, second support is $1,073 and the strongest support is $1,062.

Chart: XAUUSD W1


Friday, November 6, 2015

GBPUSD Rally Is Over

The Cable posted its biggest loss for the past month and is close to its lowest since 1st of October when price was 1.5106. Note that this level of 1.5106 was the touch of support when price skyrocketed to 1.5508 on 15th of October and then again made a high of 1.5496 on 2nd of November thus forming a double top.

If price reaches levels around 1.5115-1.5100 this might be a good opportunity to go long with a tight stop right below 1.51.

Although price is well below the support line on the upward channel, this does not mean bulls have given up on the pair.

Chart: GBPUSD D1


Thursday, November 5, 2015

Time to buy Gold?

Gold lost a few more dollars these past few days posting a loss of $36 total this week going from $1,142 to $1,106. With price well below the 200SMA and on a strong support level this might be a good time to go long on Gold and wait for the long projected $1,200.

First support level is $1,107, second appears to be $1,096. So if you have open positions you might want to consider closing them if price falls below $1,096. First resistance is $1,118, second resistance is $1,127. Above $1,127 bullish trend will be confirmed. Until then, use tight stops and have patience.

Chart: XAUUSD H4


Wednesday, November 4, 2015

GBPUSD Insecure

The Cable is trading insecurely for the past few days with prices above the resistance zone of 1.5390. In the coming days it would become clear whether the pair is going to hold above the resistance line. Note that yesterday the prior pivot point was reached and prices reverted back to the upside.

Strong resistance remains the 1.55 level. Considering market sentiment is strongly bullish we may see a break out of resistance but until we witness a close above 1.55, the pair is still in transition.

Chart: GBPUSD D1


Tuesday, November 3, 2015

Gold Posts New Losses

Today the precious metal kept the direction from the last week posting new losses. Gold went as low as $1,131 and is close to the strong support around $1,125-$1,130. It is possible that we will witness an attempt to break the support line but unless we close below $1,120 the support is still in play and a possible upward move could be expected.

Look for first support around $1,127, if this level is breached the possible scenarios are not positive for Gold. First resistance is $1,139.

Chart: H1 XAUUSD


Monday, November 2, 2015

Gold Below $1,140

The precious metal is trading lower in today's early European session. Partly the reason for Gold depreciating is the major loss it posted last week. The momentum is still present and Gold went below $1,140 for the first time since October 8th.

First level of support is $1,127, S2 is $1,105 S3 is $1,081. Below $1,073 we would probably be witnessing the FED raising rates.

Chart: XAUUSD H1


Friday, October 30, 2015

The SMART Approach To Trading Research

As you know, from time to time I share with you resources such as free webinars that can improve your trading performance and increase profits.

If you follow closely ActivTrades you would know that their latest webinar "The Smart Approach To Trading Research" was packed with useful insights and knowledge. This time it was Paul Matheson who conducted the webinar and provided complex strategies in a simple manner. If you watched the webinar you know what is meant by SMART:


Make sure you follow future free events by staying up to date with their webinar page HERE.

Thursday, October 29, 2015

EURUSD Broke Support

The pair fell sharply yesterday after the FOMC did not take any action to change the interest rate, keeping it at its current near zero. The FOMC voted 9-1 to leave the Federal Funds Rate unchanged between zero and 0.25%. The Fed also hinted that a raise is still on the table before the end of the year. The hawkish stance sent the euro tumbling against the dollar, as it fell below 1.09 for the first time since early-August.

The pair is currently trading at 1.0968 witnessing some short-covering and profit taking but the negative impact would leave the pair unstable for the next few days at the least.

Chart: EURUSD D1


Wednesday, October 28, 2015

EURUSD Below 200SMA

The pair is in its 4th day to trade below the 200SMA. It is currently on its strong support level on the lower trend line at 1.10. Although the pair tried to climb above the 1.11 mark it failed to maintain momentum and gave up in the face of all the bears in the market.

In light of the strong support now might be a good time for long-term traders to open a long position with a tight stop below 1.0965. But I personally would advise all bulls to be patient and observe what the pair will do in the next few days and will it manage to go over the 200SMA. The general rule is "stay away from everything that is below the 200SMA", don't forget this!

Chart: EURUSD D1


AUDUSD Losing Ground

The pair fall to its three-week low in the early trading European session today. It hit 0.7110 and is currently trading at 0.7125. It managed to hold in the descending trend channel as it found resistance around the upper line at 0.7380.

If it continues to trade in the channel, resistance could be expected at 0.7250 while immediate support is 0.7060 and then 0.6980. From there, price could try and form a new upward channel, according to technicals.

Chart: AUDUSD H1


Tuesday, October 27, 2015

Gold Steady

The price of Gold has been relatively unchanged for the last few days, circulating in the range between $1,170 and $1,160. Currently Gold is trading at $1,164 and all this consolidation might mean one thing - it's about to head either down or up. Now, technically Gold was in sell zone when it reached $1,192 and fell below $1,178.

What happens next would be decided by the tape so do not try and fight the tape. Main trend remains pointing to the south and I am expecting a fall below $1,000 for the next year.

Chart: H1 XAUUSD


Thursday, October 22, 2015

EURUSD Sharply Lower

The EURUSD opened at 1.1340 today and is currently trading at 1.1110-1.1112. This is due to the press conference of Mario Draghi and the ECB rate decision. President Mario Draghi said that the bank will reassess whether to extend its massive bond-buying program by the end of the year. Draghi and ECB members left the door open for more monetary stimulus but stopped short of announcing any new policy measures. Because of this announcement the Euro lost more than 200 pips against the once again dominating US Dollar.

Strong support may be found at 1.1070 and if this level is breached it would be best to wait and stay away until price defines a new trend.

Chart: EURUSD H4


Gold Below 200SMA

For the past few days Gold was trying to keep its position above the 200SMA. This is the only reason investors and traders held their long positions in the precious metal. Expectations, however, are often different than reality. This is the case that we witnessed in this scenario, too. 

Gold climbed above the 200SMA, stayed there for a few days and reversed back below it. It went up to $1,192 and then a few days later fell to $1,163 to currently trade at $1,167. 

Market sentiment remains bearish, so if you have any open long positions you may want to wait for brighter days. 

Chart: H1 XAUUSD


Wednesday, October 21, 2015

Will S&P500 Reverse?

Reject or project? This is the question we ask today. Will S&P be rejected or projected when it reaches the inflection point at 2,050-75? The chart shows that S&P is facing strong resistance at the level around 2,050-75.

A few minor technical divergences show that the index has been weakening these last days. Watch for bearish divergences, selling pressure or an intraday reversal below resistance as early sell clues.


Tuesday, October 20, 2015

Crude Lower

Crude oil reached as low as 45.76 in today's trading session and is currently trading at 46.30. Technically, it is still far from its support line at 45.10 so a sharp sell-off could be expected until it reaches this buy-zone and bulls take advantage of the commodity.

With the expiration date a few days behind us it might be a good strategy to buy the dips now and hold for $52-$53 but the risk is that bears are not done yet with Oil so bulls might want to wait a few more days.

Chart: USOil D1