A new trading tool called SmartTemplate is now available to all ActivTrades clients. In its essence, SmartTemplate is designed to show long and short trading opportunities. It can be used on MetaTrader 4 as an indicator tool.
The SmartTemplate has four main functions:
Market Strength - It measures market volatility based on the average volatility.
Daily Market Trend - shows the main trend based on a daily time frame.
Market Direction - shows the market direction based on different time frames.
Overall Strength - it indicates the overall signal given by SmartTemplate.
SmartTemplate can be used by both novice and experienced traders as its interface and features are user friendly and intuitive. If you want to check it out just go HERE.

Friday, September 30, 2016
Thursday, September 29, 2016
USD/JPY Higher
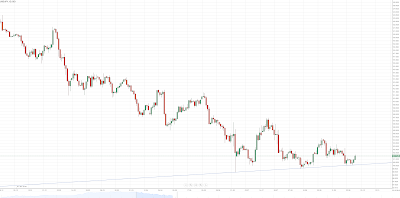
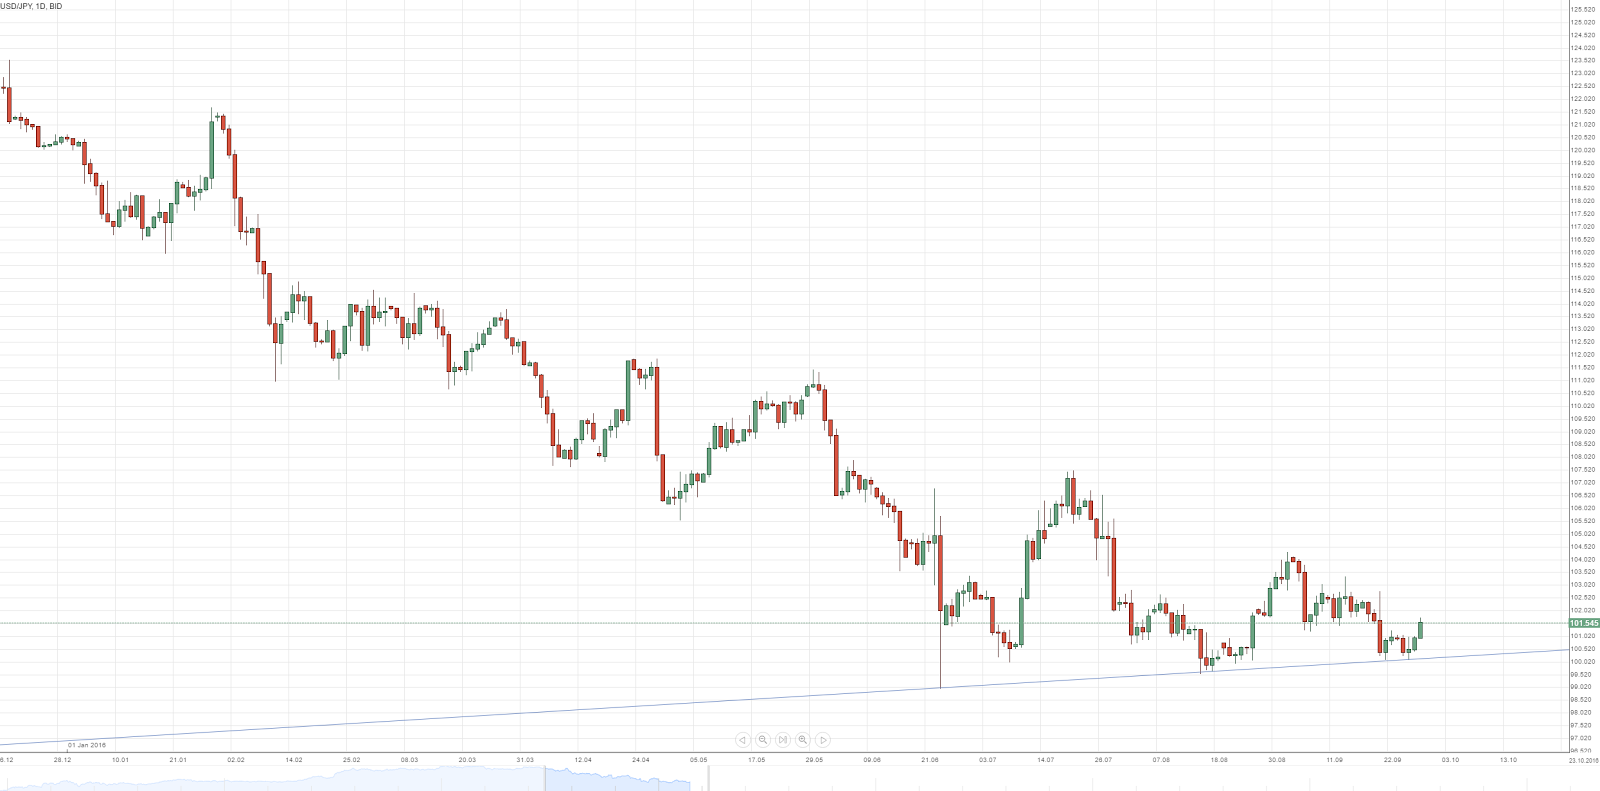
USD/JPY received a boost in price due to lower than expected Japan data. The pair was trading at 100.10 earlier this week and today it made a high of 101.75. Both technicals and fundamentals played a role as the pair reached a strong support zone at the latest low and bulls reacted to support the price from falling further.
Moreover, depreciation in price was strengthened due to the economic data released in the early trading hours. JPY retail trade YoY and MoM turned out to be worse than the forecast, as well as JPY Large retailers' sales were also below expectations. Have in mind that these factors do not play a major role in determining the direction of the trend.
Tomorrow, however, we have the JPY National Consumer Price Index YoY (AUG) and this is something we need to keep an eye on.
Chart: USD/JPY D1
Wednesday, September 28, 2016
Gold Tumbles Down
Gold has lost some significant amount of its shine in the last few days. Only on Monday, the precious metal was trading at a high of $1,342 and has been depreciating since then. Gold bears seem to have taken the initiative as prices are down some $20 to a low of $1,322 made earlier today.
What creates the uncertainty, however, is not the latest drop but the current roller-coaster Gold has gotten into for the last three months. Gold is trading in a very narrow range between $1,370 and $1,310. Some major banks predict a price of $1,300 which might actually come to pass as bulls are apparently losing the grip and sooner than we think, price might retreat to the lower $1,300's.
Until then, major resistance is of course the $1,400, only after first resistance at $1,345 has been taken out. First support is seen at $1,315, while major support rests at $1,290.
Chart: XAU/USD D1

Tuesday, September 27, 2016
EUR/USD Lower After The Presidential Debate
EUR/USD reacted somehow bearish to the presidential debate hosted yesterday. This is normal, considering the grandiose change that will come to pass in less than a few weeks. The debate was focused on bringing back jobs, prosperity, growth and rising incomes. Improving the economy and the optimistic outlook of both of the candidates boosted only slightly the US dollar.
EUR/USD went from a high of 1.1280 to a low of 1.1239. Price has stabilized and is currently gravitating towards 1.1242. If the current momentum keeps going, bears will drive price down to a possible first target at 1.1150. If bulls turn the tide, first major target is seen at 1.1310.
As to the debate, Mr Trump and Mrs Clinton did not give enough incentives to the market participants in their first debate. Two more debates yet to come.
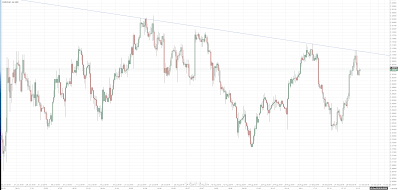
Chart: EUR/USD H4

EUR/USD went from a high of 1.1280 to a low of 1.1239. Price has stabilized and is currently gravitating towards 1.1242. If the current momentum keeps going, bears will drive price down to a possible first target at 1.1150. If bulls turn the tide, first major target is seen at 1.1310.
As to the debate, Mr Trump and Mrs Clinton did not give enough incentives to the market participants in their first debate. Two more debates yet to come.
Chart: EUR/USD H4

Monday, September 26, 2016
GBP/USD Lower
The Pound is having a bad start of the week going lower against its major competitor the US dollar. GBP/USD opened at 1.2986 and made a low of 1.2969. The pair is close to visiting the support level at 1.2940. Price already met the support three times starting from the very bottom of 1.2795 and slowly making its way up to hit the support for second time at 1.2865 and then again at 1.2914.

GBP/USD is currently trading at 1.2972 and it appears that for now the support level has managed to withhold Pound bears. If this is the case, then Pound bulls need to create some momentum and drive price to first bull target at the last high of 1.3122.
On the other hand, if bears take control, then the pair might revisit the 30-year low of 1.2795.
No major news are expected today so we might be in for technical trading Monday.
Chart: GBP/USD H4

Friday, September 23, 2016
EUR/USD At Resistance
EUR/USD is trading at resistance since yesterday when the pair reached a high of 1.1257 which just pierced through the resistance and then pulled back to lower levels. The pair is currently trading at 1.1212 and it appears that it's not yet ready to go lower than 1.1194 which was the lowest since yesterday.
Bulls need to get past the resistance at 1.1250 and if that happens next bull target is seen at 1.1310 which might be a stronger resistance zone.
On the other hand, bears need to keep price in the descending channel. If they can get a close below 1.12 this would be a strong early indicator that next week the pair might keep pushing lower.
No major news are scheduled for today.
Chart: EUR/USD H4

Thursday, September 22, 2016
Fed leaves rates unchanged but hints a raise before year end
The Federal Reserve left the rates unchanged in yesterday's FOMC meeting. However, a rate increase is most likely to happen before year end, as Chair Yellen said that the case for a rate hike "has strengthened".
Market participants did not expect a rate raise and they didn't get one so the market environment didn't change much. The US dollar lost less than a percent against its major competitors and that appears to be normal. However, the pressure is building and if Fed wants to ease off a bit and create a calm market environment for next year, they need to move in December.

Three out of ten of the rate-setters voted against the decision to leave rates unchanged and called for a September increase. According to the words of Chair Yellen, the Fed needs to wait for "further evidence of progress towards its objectives" before taking the decision to hike.
Market participants did not expect a rate raise and they didn't get one so the market environment didn't change much. The US dollar lost less than a percent against its major competitors and that appears to be normal. However, the pressure is building and if Fed wants to ease off a bit and create a calm market environment for next year, they need to move in December.

Wednesday, September 21, 2016
Yen Falls, Eyes on FOMC
The Japanese Yen suffered a fall as the Bank of Japan introduced an updated QQE stimulus in an effort to control the yield curve. Initially, the Yen rose sharply but the real effect was felt minutes later when the actual intentions were clarified.
Currently, USD/JPY is trading at 102.58 which isn't that much of a significant change. Still, the pair is yet to get volatile as the FED is about to announce whether they are raising rates or not. FED Chair Janet Yellen has made multiple remarks that they want to introduce the rates in a very calm manner as to not create excessive volatility and uncertainty in the markets. Rumor has it, they are setting the stage for a December hike and this is the reason the US dollar is strengthening right now.
The FOMC meeting is scheduled for 2PM EDT, and thirty minutes after that, Chair Yellen will be holding a press conference answering questions from the audience.
Tuesday, September 20, 2016
GBP/NZD Support Broken
GBP/NZD is trading below long-term support. The pair was heavily impacted by bearish pressure today and finally it broke below the long-term support at 1.7700. GBP/NZD is now 1.7655 with a low of 1.7642.
Main trend on the long-term continues to be bearish, moreover today's breakout would probably trigger even more of a sell off considering the fact that this is an all time low for the pair.
On the other hand, bulls might still have something to offer if they manage to keep the price above 1.76 before they eventually take over and push prices back above the support line.
Right now the best strategy would be to wait for more certainty. Certainty is the least likely term to describe this week as we have the FED meeting scheduled for Wednesday where FED Chair Janet Yellen will either raise rates or keep them as they are. Whatever it is, markets will react.
Chart: GBP/NZD D1

Monday, September 19, 2016
Gold Up
Gold met support on Friday and since then the precious metal has been having a move up. It touched support at $1,306 and although slowly, it managed to stay above the support line and bounce off to a current price of $1,315, which is close to the highest price of $1,317 since the move started.

It is still very uncertain whether Gold will be able to sustain the momentum as we have been trading in the range of $1,310 and $1,350 for the last three months or so. However, if the support level is strong enough and bulls give it a good boost, Gold's price could very likely climb to $1,400 considering the FED doesn't make a move this month or the next.
Whether the FED will raise rates or not will be announced on Wednesday this week.
Chart: XAU/USD D1

Friday, September 16, 2016
The Four Pillars of Personal Development in Trading | Webinar Review
We all have heard the story about how 85-95% of the retail traders fail to survive in the trading industry and how they lose all of their money in the first three to six months of trading. The problem is not whether this is true, but whether this applies to you. If you believe you can win at trading the markets you should most likely have already devised a strategy.
A strategy has to have foundations. Such foundations were presented yesterday in a webinar hosted by ActivTrades and presented by Paul Wallace. The webinar was called "The four pillars or personal development in trading". Guest speaker Wallace talked about his understanding of what needs to be done even before you started trading.
Real and long-term success in trading, according to speaker Wallace, is possible if you have a set of rules and a firm foundation which lays out the path to achieving mastery in trading.
To stay up to date with all free webinars by ActivTrades go HERE.
If you missed the webinar, it should be uploaded soon in the archives.
Thursday, September 15, 2016
Silver Unsteady
Silver is being very unsteady in its last days and has been a really difficult asset to handle. The metal is having good days and bad days every other day. It reached 18.73 a few days ago and then the next day it went to a high of 19.30 only to fall short and go back below 19. Currently, Silver is trading at 18.93 and as it looks, there isn't much to support the price from falling further.
Technically speaking, the metal is having difficulties sustaining its current price as market participants appear to be losing interest in holding it much longer. Moreover, if the US data scheduled for tomorrow turns out positive, bulls might lose momentum which will drive price to a possible first bear target at 18.40. If that level doesn't hold the bearish pressure, Silver might end up at the long term support zone around the 200SMA at 17.40
We have mild-impact news today coming from the US that would most likely have little to no impact on the price of Silver.
Chart: XAG/USD D1

Wednesday, September 14, 2016
USD/JPY Close to a Possible Break Out
USD/JPY continues its upward move started in the early trading hours yesterday. The pair moved from a low of 101.41 to a high of 103.33. This movement comes as an addition to a series moves causing the pair to fluctuate aggressively in the range between 100 and 104 in which the pair has been caught for the last few weeks.
As of now, it appears that USD/JPY might attempt to break current resistance in the face of 103.50. If this happens then we will have to establish a new order of events as the old pattern will be invalidated.
First bull target is seen at last high of 104.32 while first support is seen at 103.00. No fundamentals are scheduled for today so we might see technical bulls trying to beat the resistance at 103.50
Chart: USD/JPY H4

Tuesday, September 13, 2016
USD/CAD At Resistance
USD/CAD is trading in a choppy environment for the past few weeks. The pair has been going up and down in the range between 1.3130 and 1.2780. The pair has been seeing high volatility in part because it did a major move going from a multi-year high of 1.4680 to a low of 1.2462 in a few months the beginning of this year. Some market experts consider this the last third of the big move where prices go parabolic due to the high volatility created by buyers and sellers.
All this could mean that the pair is still in it's uncertain environment so paying attention to the clues of the ticker might prove to be crucial for success.
USD/CAD found resistance at yesterday's high of 1.3124 and then retreated to lower levels. The pair is currently trading at 1.3048 and it looks like it still hasn't decided what to do next so staying out of this market might the best decision today.
Chart: USD/CAD H4

Monday, September 12, 2016
Gold Posts New Losses
Gold lost a few dollars in the closing hours of Friday's session due to higher expectations that a rate hike is planned for September's FED meeting. The precious metal was trading around $1,350 on Thursday and started depreciating since then. On Friday the pair reached a low of $1,327 which was also the closing price for the week.
Currently, Gold is trading relatively unchanged at $1,329 and as it looks, price might consolidate in current levels due to lack of fresh news for the day and nothing to cause any movement. First support is seen at last low of $1,324 made in the opening hours of today's session. If that level is broken, we might see price revisit $1,300.
On the other hand, if bulls take control they will attempt to break the resistance level at $1,350 and move higher to a possible major target at $1,400.
Chart: XAU/USD H4

Friday, September 9, 2016
Gold Steady
Gold has entered into low volatility environment and is trading with very low volumes so far. The precious metal opened at $1,337 and is now $1,334. It is not doing much today but this can be considered normal having in mind that we have no important US data scheduled. Maybe traders and investors can use a bit of peace in this otherwise very volatile market.
On one hand, Gold has reached a support zone at current market price and this might be the reason for the low volatility we witness today. On the other hand, market participants can anticipate the movement of the metal and drive it into either directions. Whatever it may be, Gold had an impressive first half of the year and not so impressive second half so far.
Exciting moments are ahead of us in Gold market until the end of the year and two major events would be the September and December FOMC meetings.
Chart: XAU/USD D1

Thursday, September 8, 2016
GBP/JPY Posts Losses
GBP/JPY continues its downward movement today that started on Sept 2 when the pair reached resistance which might be considered the right shoulder in a Head and shoulders pattern. So far the pair has been successfully drawing the continuation of the H&S pattern but if we want to press forward we have to break the current support level at 135.50.
Is 135.50 is broken then the path to the neckline looks like a very good and probably objective. The neckline is at 129.50 which would then have to be broken if the H&S is to be validated. Until now, the pair has had an exciting journey going twice from the multi-year low of 129.25 to above 138.
By all means, this looks like the final third of the major move from 195.88 and as we know, the last third of the move is usually the hardest one to trade as prices go parabolic and volatility is destroying people's accounts.
Chart: GBP/JPY H4

Wednesday, September 7, 2016
USD/JPY Sharply Lower
It may come as a surprise to some people to see the Yen rallying again after the "Abenomics" is about to take place and depreciate the Japanese currency. The reason behind the latest rally is the weak US data that has been coming out this week and last Friday.
First, we had lower than expected jobs report at 155K, way off from the 180K expected. Although experts say anything above 100K in a month is good, traders and investors couldn't sustain the bullish momentum in the US dollar and yesterday when the ISM data was released the bears took over. The US dollar dropped sharply against all pairs on result of 51, a lot lower than the 55 expected.
These signs are early indicators of a weakening US economy which cools off the chances of a rate hike at the third quarter of September.
Back to the Yen, USD/JPY went to 104.32 and then dropped to a low of 101.20. After the strong upward movement from 99.54 to 104.32, the pair is now again under bear pressure and it might reach the 100.00 level.
Chart: USD/JPY D1

Tuesday, September 6, 2016
USD/JPY Above Resistance
USD/JPY reached 103.80 in today's session. A level substantially higher than the resistance line at 103.00. The pair has been trading to the upside since last month when it reached a low of 99.55. Since then USD/JPY is going steadily North with only mild corrections before the upward move continues.
With the resistance level behind us, the pair is now ready to take it higher and possibly break the last high of 104.32. If that doesn't happen, then we might get back below the resistance and gravitate towards 103-102.50.
However, the double bottom that the pair formed below 100.00 level acts as a strong indicator that the downfall is over and the bulls have taken over for the long term.
Chart: USD/JPY H4

Monday, September 5, 2016
USD/CAD Down
USD/CAD was one of the biggest losers on Friday when the NFP and jobs data were released. The pair went from 1.3114 to below 1.30 and reached 1.2952 in the earlier hours today. Currently the pair is trading at 1.2960. This week we have several events that will create higher volatility and may define the trend further.
My expectations are that the pair will reach 1.3280 before the end of the week and after that there will probably be a correction as we would have reached the resistance level as well as the 200SMA.
Today, however, mild volatility can be expected as we have no data coming out and market participants might wrap up around 1.2970 in anticipation of the next big news.
Chart: USD/CAD D1

Friday, September 2, 2016
SmartPattern Is a Tool You Need To Have
An exclusive offer is available for the Live clients of ActivTrades that can make all the difference in their trading. The tool is called SmartPattern and is created to automatically detect any pattern that has been formed as an early indicator of a future market move. It is definitely worth trying, especially for the tape readers who rely a great deal on charts.
In order to use it for free you have to create a Live account and then request the software The SmartPattern trading tool does the job instead of you, which means that you can rely on it whenever you don't see anything and need to see if there is an opportunity. It is available for MetaTrader 4 and MetaTrader 5.
Sometimes a system can be more reliable and more successful than a trader. The system is not emotionally or psychologically involved in any market, while the trader can be influenced by what George Soros calls "reflexivity", i.e. understanding the markets through their own perception and expectations and not according to real price action. So a tool like SmartPattern might turn out to be a game changer.

Thursday, September 1, 2016
NZD/CAD at Resistance
NZD/CAD reached resistance for a sixth time. This is the reality in the currency market. Probably most of the people would think that it is impossible for a pair to reach a certain level six times and not be able to break it. But the chart shows that NZD bulls are unable to win the argument for a sixth time.
Today the pair reached resistance at 0.9530 and withdrew to lower levels. The positive Canadian data published yesterday was not enough to turn the tide and the pair appreciated further. As we can see, NZD/CAD is strongly bullish since April this year and if we can get a break above 0.96, this would imply that a continuation of the bull run is the most likely scenario.
Until then, simply watching the tape brings enough pleasure.
Chart: NZD/CAD D1

Subscribe to:
Posts (Atom)