The main currency pair, EUR/USD has seen a lot more volatility and excitement than what we witness these last few trading sessions. Since 8 Jan the pair has not done anything interesting or even exciting other than stay in between 1.0950 and 1.0850.
In light of this, traders and investors might start to lose patience and become risk takers. Currently, the price of EUR/USD is 1.0900 and without any major news to stir the market until the end of the week the pair might continue trading in the same range.
Major levels of support and resistance: 1.0800, 1.0100
Chart: EUR/USD D1
Thursday, January 21, 2016
Wednesday, January 20, 2016
USD/JPY Broke Support
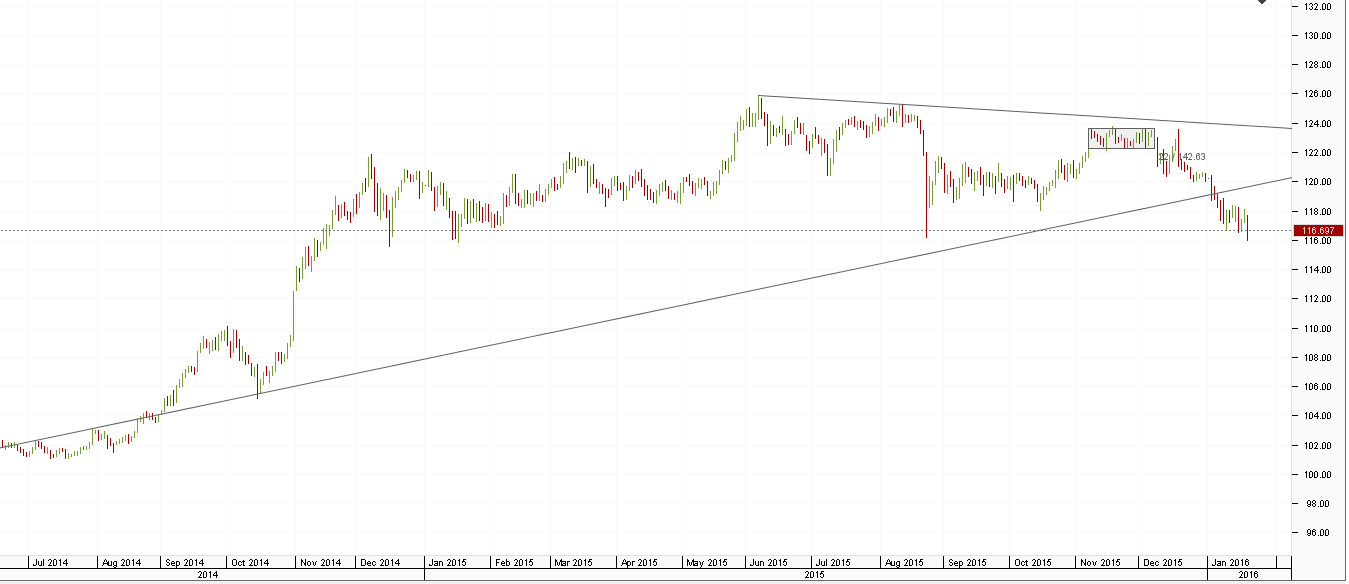
The pair is having a free roam tour below the long-term uptrend channel. Prices are currently gravitating around 116.60-116.70. However, almost a perfect double bottom could be seen on the daily chart at 115.95.
With the long-term trend broken, the only hope for the bulls now is for that double bottom to hold and push prices up again.
Should we see a break and a close below 115.90 this would indicate that bears are taking the driver's seat and USD/JPY will continue dropping in price.
Uptrend resistance: 117.80
Chart: USD/JPY D1
Labels:
chart,
dollar,
forex,
investing,
speculation,
technical analysis,
trade,
trading,
trend
Tuesday, January 19, 2016
Gold Range Bound
Gold is trading relatively unchanged for a few trading sessions now. Price is gravitating around $1,090 level with slight movement to both sides reaching $1,085 and $1,095. Currently the main trend is on hold as price has entered this range and market participants are waiting for the precious metal to pick a direction.
It would be best to stay away from the Gold market until one of those $1,085 and $1,095 is broken and price closes outside this frame.
Longer-term trend suggests that Gold will try to breach $1,120 to the upside or $1,075 to the downside. With market sentiment currently neutral, staying out is the best strategy at this time of uncertainty.
Chart: XAU/USD H1
Labels:
chart,
commodities,
dollar,
forex,
investing,
speculation,
technical analysis,
trade,
trading,
trend
Monday, January 18, 2016
Oil At $28
Removal of sanctions on Iran has hit oil markets today. This means increased supply amid a global glut. Oil is trading around 12-year low for a few days now and the price of 28.34 is the lowest. Some brokers offered a price below $28 a few hours ago.
Analysts are already targeting $20 and even $10 as the next key levels. Oil corporations are losing $1.8-2B for every $10 drop in prices. This, of course, leads them to cut jobs. Low oil prices come with benefits, too. India, Egypt and Indonesia have been able to slash subsidies worth almost $500B in 2014. Airlines and car makers are getting a boost. And this is also positive for consumers, unless of course, falling prices lead to deflationary cycles.
As to us, traders and investors, we should be very cautious when trading Oil as times such as these are difficult and markets can be unpredictable.
Chart: USOil H1
Thursday, January 14, 2016
Silver Volatile
Silver has been changing its opinion since the beginning of December. As you can observe on the daily chart, one day it has gone up only to fall down even lower the next day. This effect is due to price going into the last third of a move where it is decided whether price would turn the trend.
Currently we are still in this last one third of the downtrend and we have been range bounded for almost two months. What we can be sure of, there are a lot of market participants trying to put pressure on both sides of the trade and it would be best to wait until we have a determined and clear trend. Until then, preserve your capital and do not trade in the unknown.
Chart: XAG/USD D1
Labels:
chart,
forex,
investing,
speculation,
technical analysis,
trade,
trading,
trend
GBP/JPY Hit Support
The pair is trading at support at the moment gravitating around 169.20-169.60. Main trend continues to be bearish but the Sterling bulls are anticipating these levels and are willing to put some strong effort into pushing prices higher.
According to daily chart, prices should find strong support at current levels and bounce off. Have in mind, that the possibility of breaching this support remains.
Best decision would be to wait for today's candle to close and see where price goes tomorrow as we are in a consolidation state since Jan 11.
Chart: GBP/JPY D1
Labels:
chart,
currencies,
forex,
speculation,
technical analysis,
trade,
trading,
trend
Tuesday, January 12, 2016
USD/CAD Time To Sell?
USD/CAD has been rising in price since August 2011 and has formed a stable uptrend channel since September 2013. However, the pair might be in for a correction to the downside as it reached a peak level at 1.4268 and is currently trading around 1.4200-20.
First level of support is 1.4180, second level 1.4150 and third level 1.40.
First and strongest level of resistance is 1.4300.
If the pair continues to the downside, it could be expected that it will attempt to reach 1.37 as a target.
Chart: USD/CAD D1
First level of support is 1.4180, second level 1.4150 and third level 1.40.
First and strongest level of resistance is 1.4300.
If the pair continues to the downside, it could be expected that it will attempt to reach 1.37 as a target.
Chart: USD/CAD D1
Subscribe to:
Posts (Atom)